Figure 6.
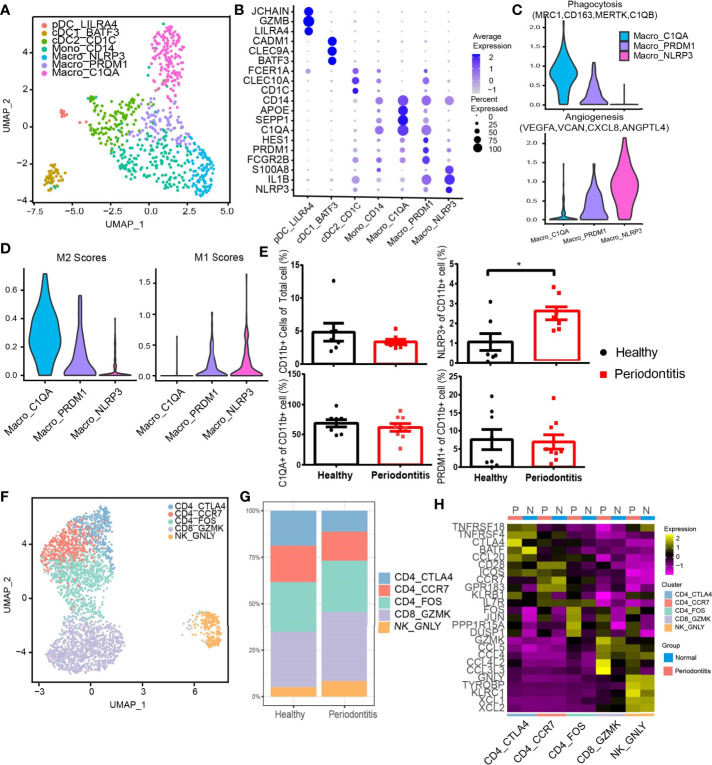
Diverse immune cell subtypes with hyperinflammatory response in periodontitis. (A) UMAP visualization of seven myeloid clusters in the combined health (n = 2; 148 cells) and periodontitis (n = 2; 539 cells) dataset. (B) Bubble heatmap showing marker genes across seven myeloid clusters from (A). Dot size indicates fraction of expressing cells, colored according to z-score-normalized expression levels. (C) Violin plots showing the expression of angiogenesis- and phagocytosis-related genes (see Methods for details) in three macrophage clusters. The gene expression levels are normalized and transformed as ln (CPM/10). (D) Violin plots showing the expression of classically activated macrophages (M1) and alternatively activated (M2) macrophage-related genes (see Methods for details) in three macrophage clusters. The gene expression levels are normalized and transformed as ln (CPM/10). (E) The relative percentage of CD11b+ cells in total cells and the proportion of C1QA+, NLRP3+, and PRDM1+ subpopulations in CD11b+ cells were analyzed by flow cytometry (healthy donors, n = 8 and patients n = 8; see Supplementary Figure S4B for gating strategy). (F) UMAP visualization of five T and NK cell subclusters in the combined health (n = 2; 276 cells) and periodontitis (n = 2; 2,599 cells) dataset. (G) Bar plots indicate the relative proportion of T-cell subsets in each sample (healthy = 2 and periodontitis = 2). (H) Heatmap showing the average expression of the top 5 differentially regulated genes for T and NK clusters identified in healthy gingival and periodontitis tissues. *P < 0.05 as determined by Student’s t-test.

