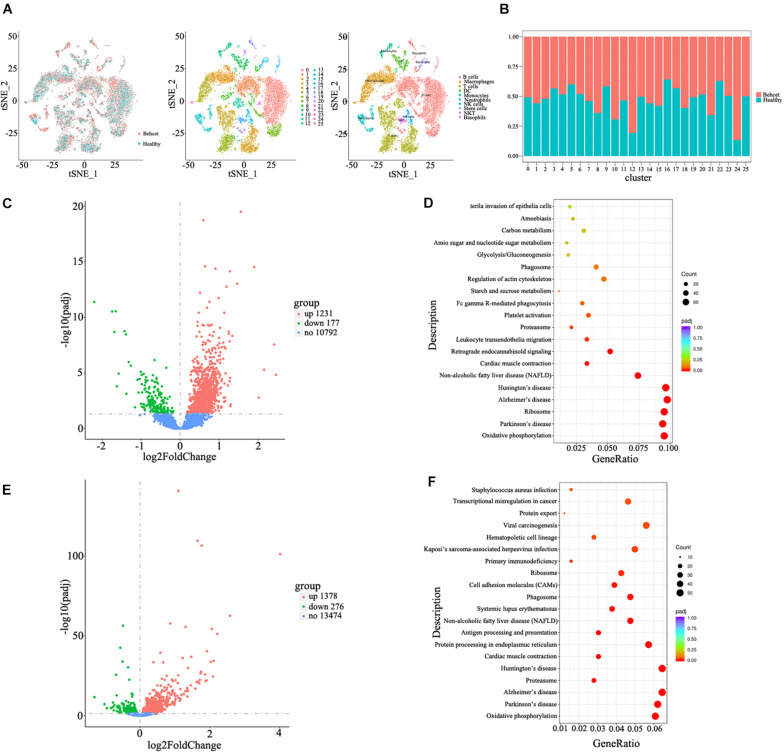
FIGURE 4.
Single cell RNA sequencing of splenic cells from mice after feces transplantation. (A) Characterization of cell types in the splenic cells in the tSNE plot; (B) The relative ratios of different cell types in the splenic cells between BD-recipient mice and healthy control-recipient mice; (C) The volcano plot of differential genes in the neutrophils between BD-recipient and healthy controls-recipient mice; (D) KEGG analysis of differential genes in the neutrophils between BD-recipient and healthy controls-recipient mice. Top twenty pathways with the most significant differences are listed; (E) The volcano plot of differential genes in the CD4 + T cells between BD-recipient and healthy controls-recipient group; (F) KEGG analysis of differential genes in the CD4 + T cells between BD-recipient and healthy controls-recipient mice. Top twenty pathways with the most significant differences are listed.

