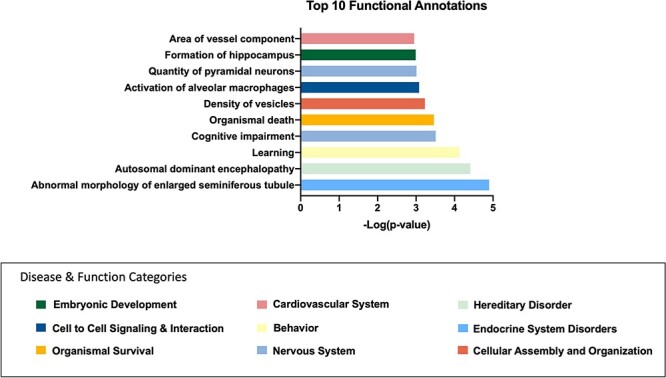
Figure 4:

top IPA disease and function annotations for cannabis users compared to controls after abstinence. Graph of the top 10 most significant disease or function annotations associated with genes differentially methylated between cannabis users and controls after abstinence. y-Axis represents the annotation, x-axis is the−log of the P-value. The colors correspond to the category for which this disease or function was annotated to (represented by the color legend at the bottom of the figure)
