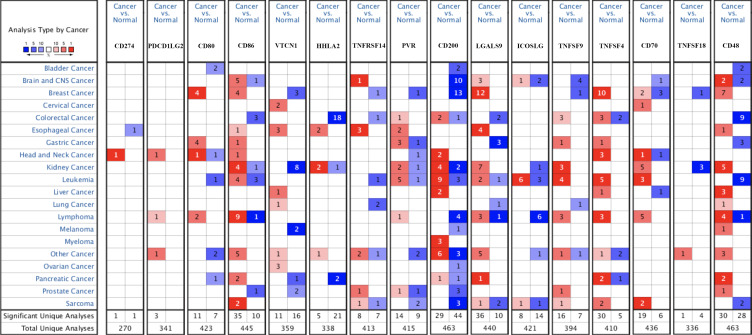
Figure 1.
The mRNA level of immune checkpoints in STAD (Oncomine). The graph shows the numbers of datasets with statistically significant mRNA over-expression (red) or down-regulated expression (blue) of the target gene with a p-value of 0.05 and fold change of 2. The depth of color is related to the differential expression sequence of genes. Saturated red(blue) graph represents top1%, medium saturated red(blue) graph represents top5%, and white red(blue) graph represents top10%.

