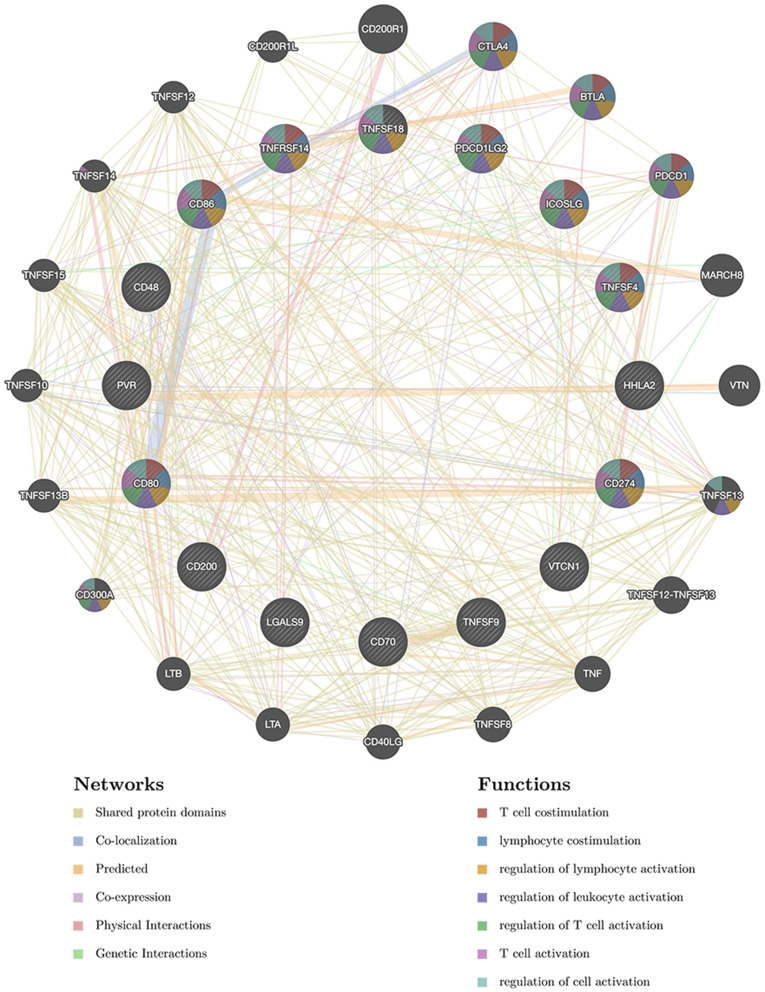
Figure 5.
Protein–protein interaction (PPI) network of immune checkpoints networks. PPI network and functional analysis indicating the gene set that was enriched in immune checkpoints networks. Different colors of the network edge indicate the bioinformatics methods applied: co-expression, website prediction, co-localization, shared protein domains, physical interaction, pathway and genetic interactions. The different colors for the network nodes indicate the biological functions of the set of enrichment genes.

