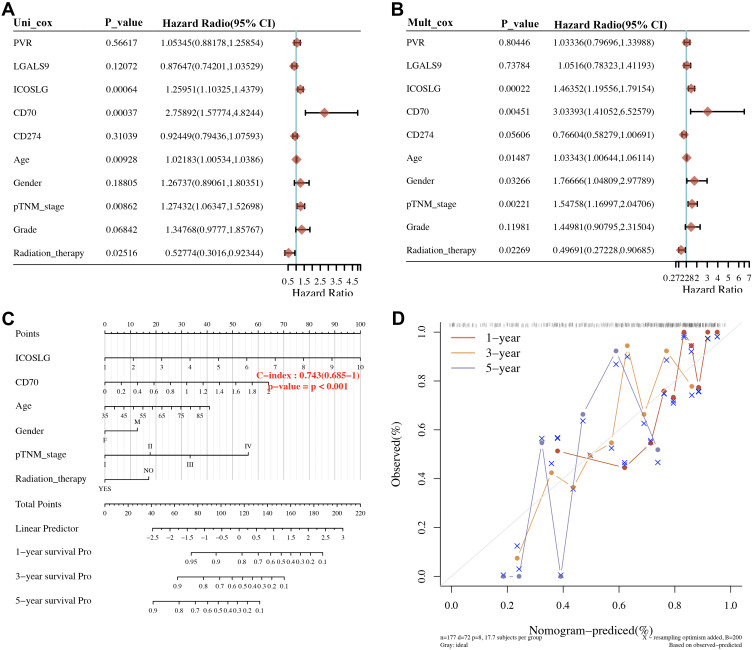
Figure 8.
Univariate and multivariate cox regression of immune checkpoints in STAD. (A, B) Hazard ratio and P‐value of constituents involved in univariate and multivariate Cox regression and some parameters of the immune checkpoints. (C, D) Nomogram to predict the 1-y, 2-y and 3-y overall survival of STAD patients. Calibration curve for the overall survival nomogram model in the discovery group. A dashed diagonal line represents the ideal nomogram, and the blue line, red line and orange line represent the 1-y, 2-y and 3-y observed nomograms.

