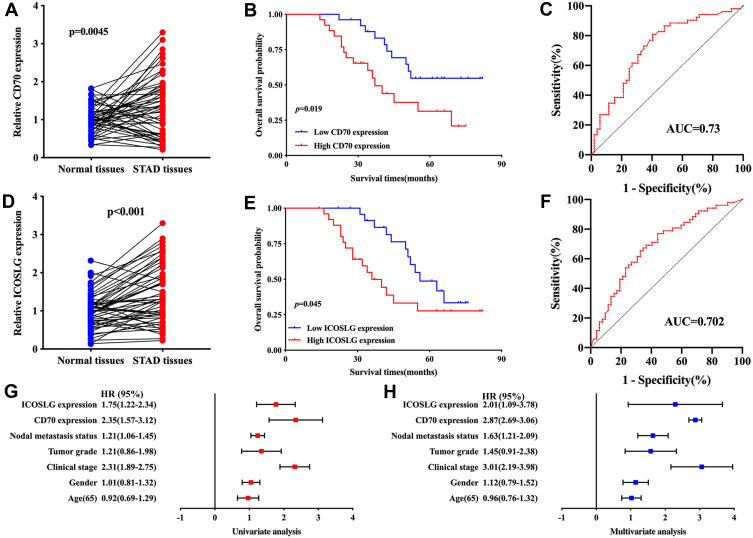
Figure 9.
Validation of the expression and overall survival of CD70/ICOSLG in STAD. (A) the level of CD70 in STAD and normal tissues. OS curve of STAD patients with high/low CD70 expression (B) and ROC curve evaluating the predicting performance (C) in STAD. (D) the level of ICOSLG in STAD and normal tissues. OS curve of STAD patients with high/low ICOSLG expression (E) and ROC curve evaluating the predicting performance (F) in STAD. (G, H) Univariate and multivariate analysis considering CD70 and ICOSLG expression as well as clinical characters.

