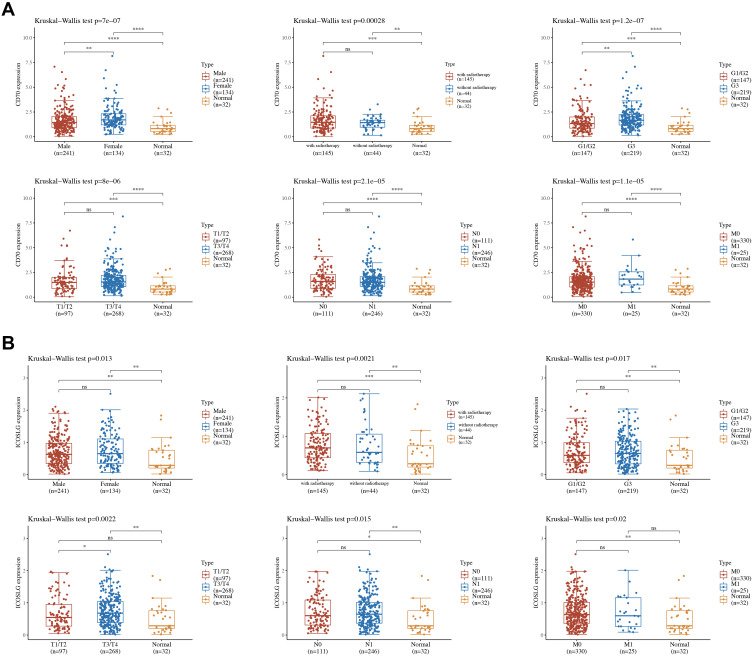
Figure 10.
The expression of immune checkpoints in the subtypes of STAD tissues and normal tissues. (A) The expression distribution of subtypes of STAD tissues and normal tissues. (B) The expression distribution of subtypes of STAD tissues and normal tissues. The horizontal axis represents different groups of samples, the vertical axis represents the gene expression distribution, where different colors represent different groups, and the upper left corner represents the significance p-value test method. *p < 0.05, **p < 0.01, ***p < 0.01, ****p < 0.01.

