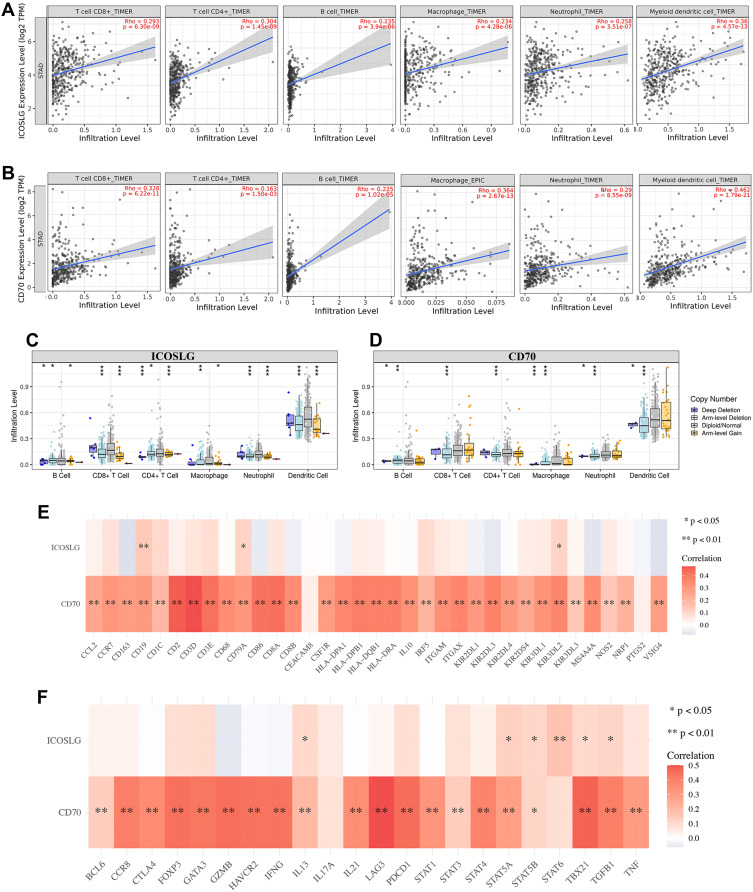
Figure 11.
The correlation between immune checkpoints and immune infiltration (TIMER). (A) The correlation between ICOSLG expression and the abundance of CD8+ T cells, CD4+ T cells, Macrophage, Neutrophils and Dendritic cells. (B) The correlation between CD70 expression and the abundance of CD8+ T cells, CD4+ T cells, Macrophage, Neutrophils and Dendritic cells. (C) the correlation between SCNA of ICOSLG and immune cell infiltration. (D) the correlation between SCNA of CD70 and immune cell infiltration. (E, F). The correlation between immune checkpoints and the expression of immune biomarkers in STAD. Red color represents positive correlation, blue color represents negative correlation. *P < 0.05, **P < 0.01, ***P < 0.001.
Abbreviation: SCNA, somatic copy number alterations.

