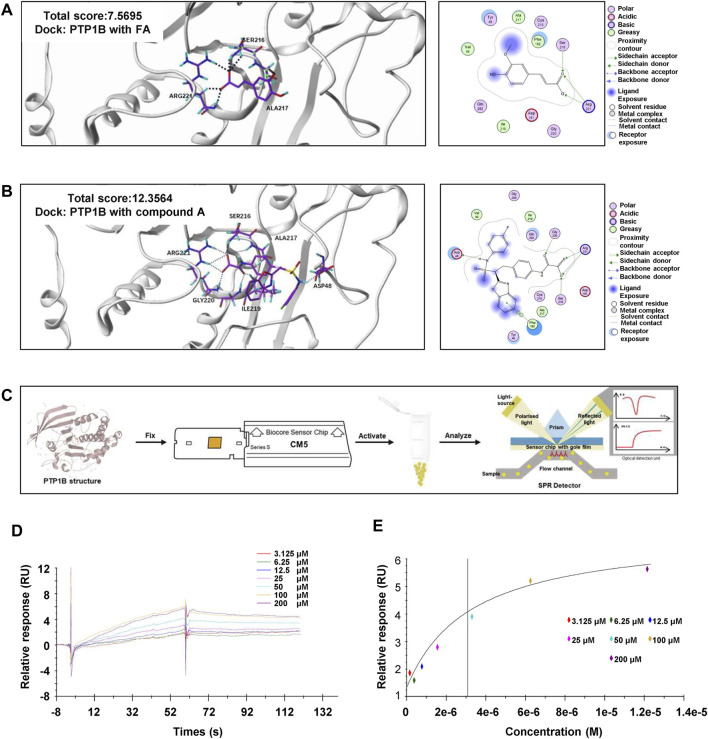
FIGURE 5.
FA directly binds to PTP1B. (A) Representative images for the binding mode of FA and PTP1B with the crystal structure of PTP1B (PDB ID: Ser216, Arg221, Ala217). (B) Representative images for the binding mode of compound A and PTP1B with the crystal structure of PTP1B (PDB ID: Arg221, Ser216, Ala217, Gly220, Ile219 and Asp48). (C) The process flow diagram of SPR. (D) The concentration gradient binding curves of protein PTP1B with FA (3.125, 6.25, 12.5, 25, 50, 100 and 200 μM). (E) The representative binding curve of FA binding to PTP1B. All the experiments were conducted three independent times.

