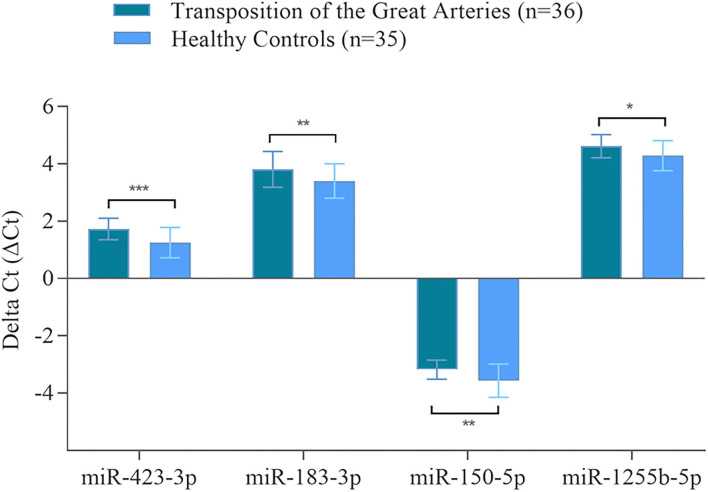
Figure 2.
Validated miRNAs in the blood of TGA-RV patients compared to healthy controls as determined by RT-qPCR. Mean ΔCt of all TGA-RV patients and ΔCt of all healthy controls (lower ΔCt, higher abundance level). RNAU6B was used as endogenous control for normalization of miRNA. Unpaired Student's t-test and mean ± standard deviation were used to evaluate differences in abundance levels. *p ≤ 0.05; **p ≤ 0.01; ***p ≤ 0.001.

