
Fig. 3.
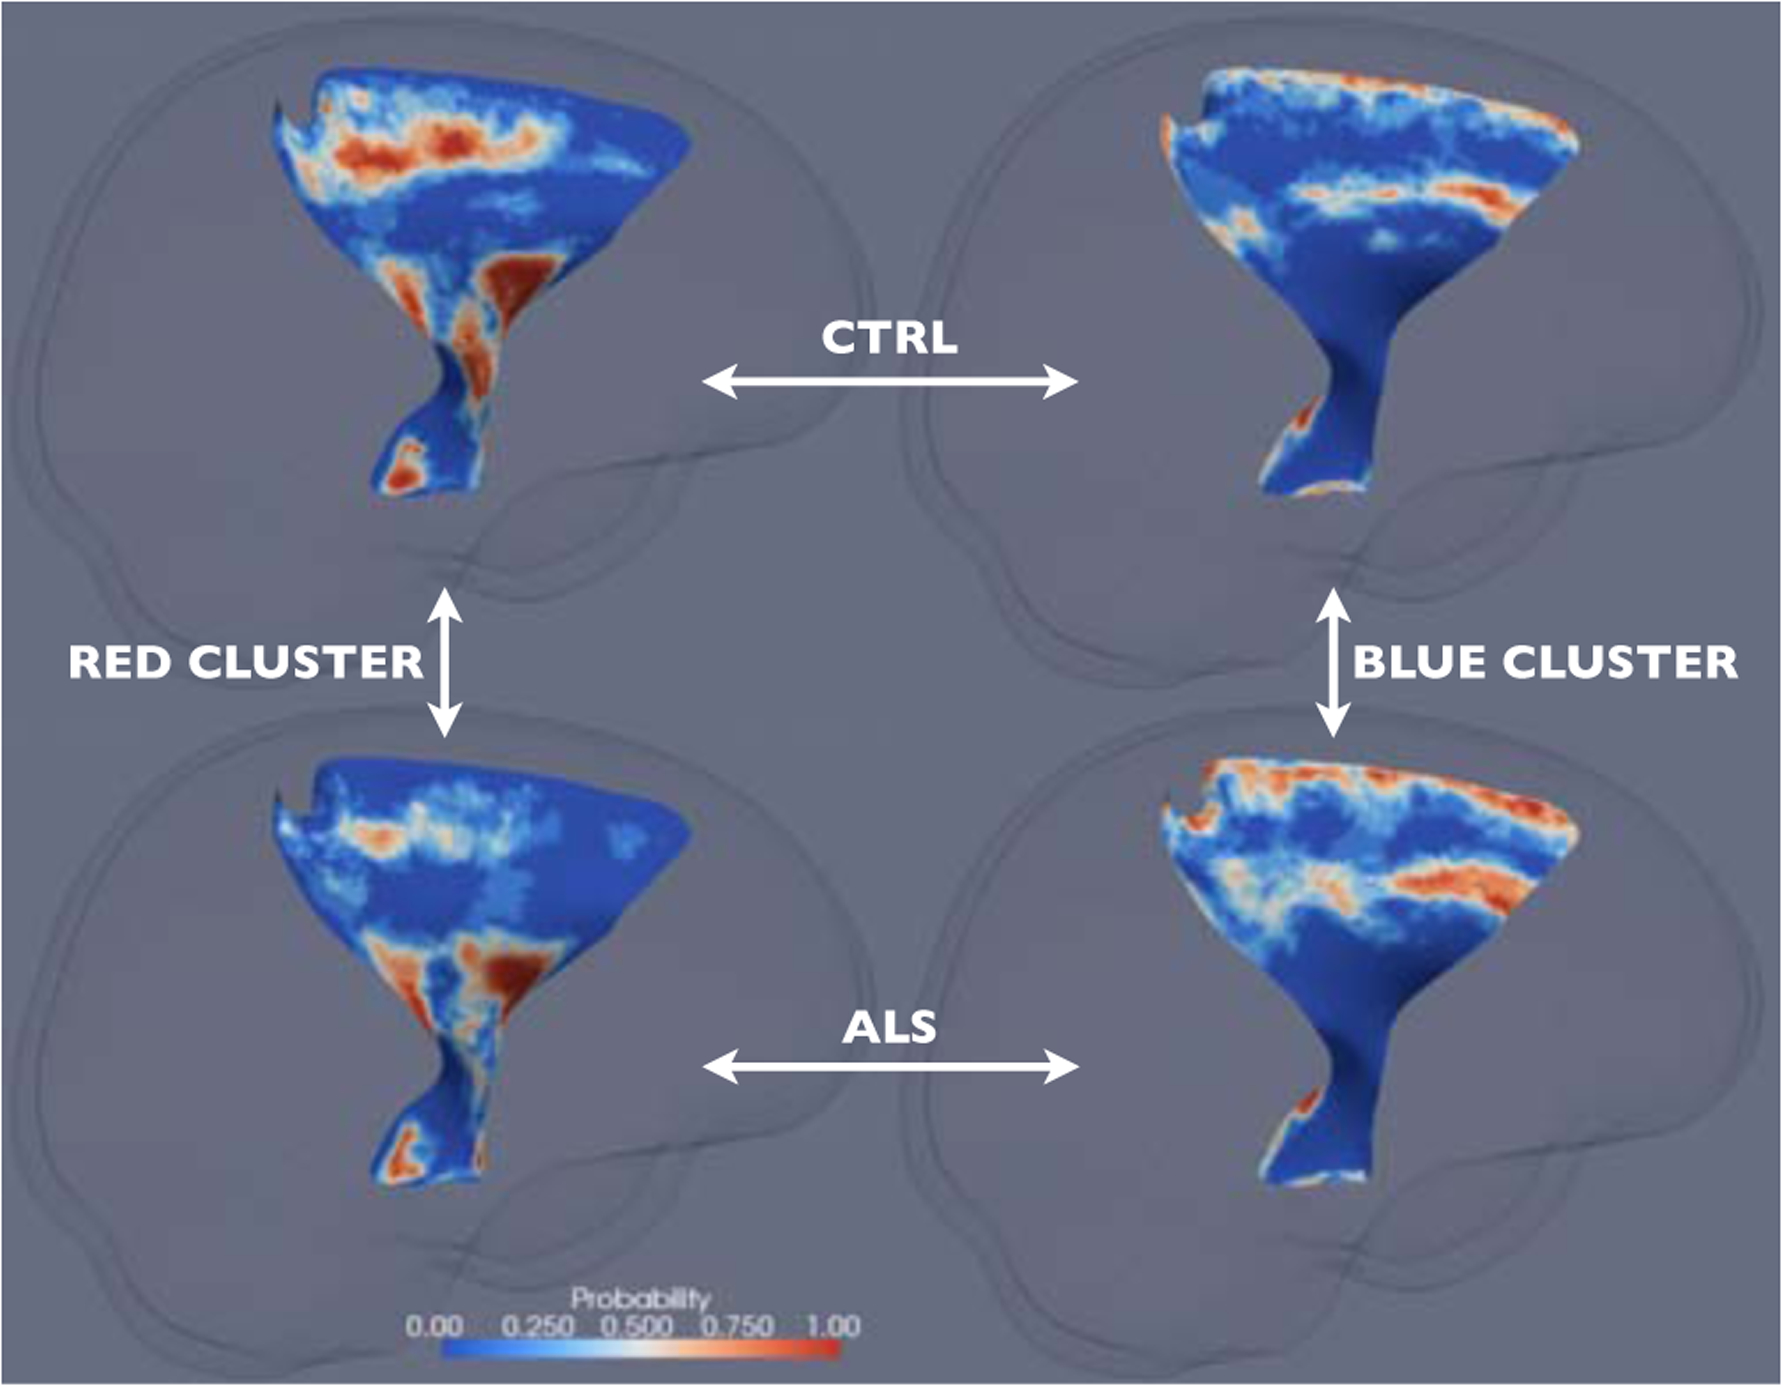
The cluster-membership probability maps on the left CST for the red cluster and the healthy controls (top left), the red cluster and the ALS patients (bottom left), the blue cluster and the healthy controls (top right), and the blue cluster and the ALS patients (bottom right). See Sec. 3 for details.