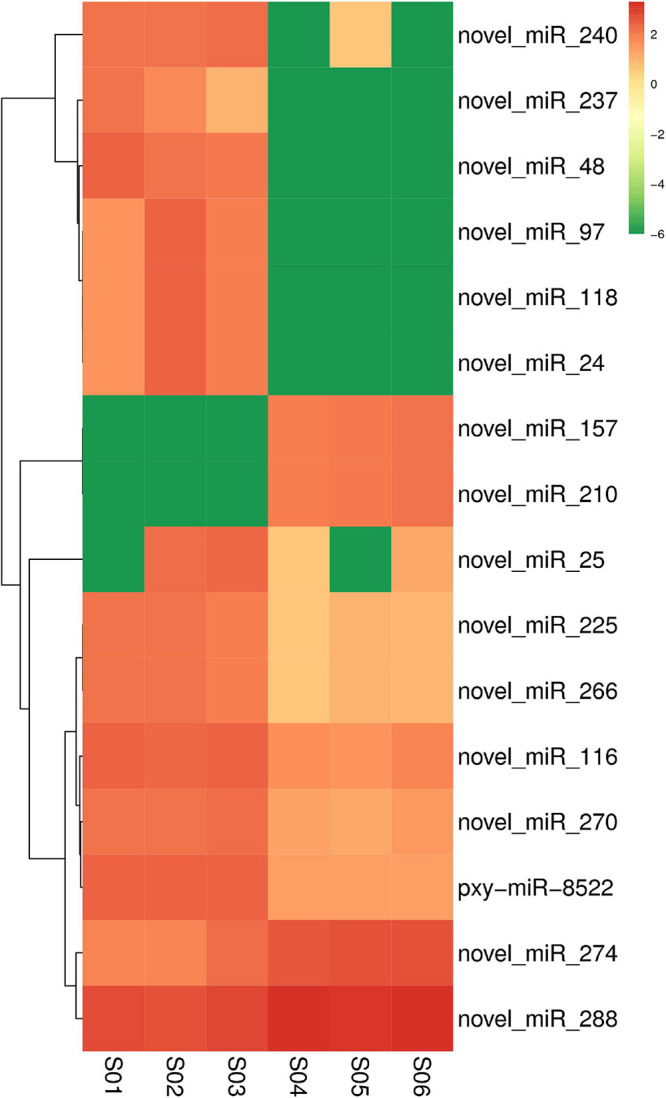
FIGURE 4.

Cluster analysis diagram showing the differentially expressed miRNAs in the resistant (Cry1S1000) and susceptible (G88) strains. Clustering was performed with log10 (TPM + 1E-6) values. Samples of the G88 strain, S01–S03; samples of the Cry1S1000 strain, S04–S06. Columns represent different samples, while rows indicate different miRNAs. Red blocks represent the higher expressed miRNAs, green blocks represent the lower expressed miRNAs.
