FIGURE 5.

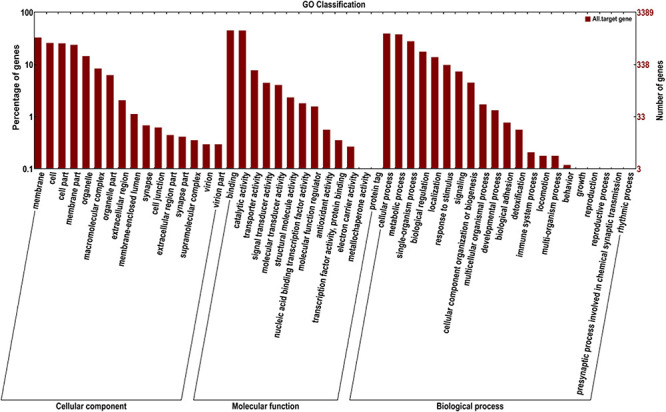
Gene ontology (GO) annotation of the genes targeted by identified miRNAs. The X-axis shows the GO annotation, and the Y-axis shows the ordinate left in the percentage of genes.

Gene ontology (GO) annotation of the genes targeted by identified miRNAs. The X-axis shows the GO annotation, and the Y-axis shows the ordinate left in the percentage of genes.