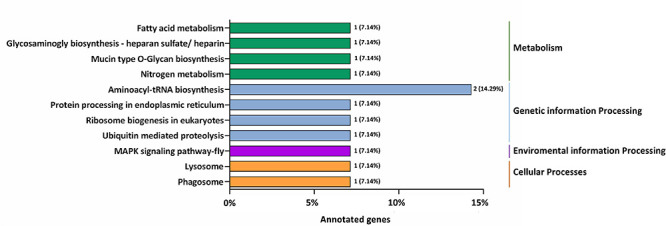
FIGURE 6.

The most enriched KEGG pathways based on the genes targeted by differentially expressed miRNAs in the resistant (Cry1S1000) and susceptible (G88) strains. The X-axis shows the number of genes annotated to the pathway and the ratio of the number of annotated genes to the total genes annotated, and the Y-axis shows the pathway names. The different color of column indicates different type of KEGG pathway.
