
FIGURE 7.
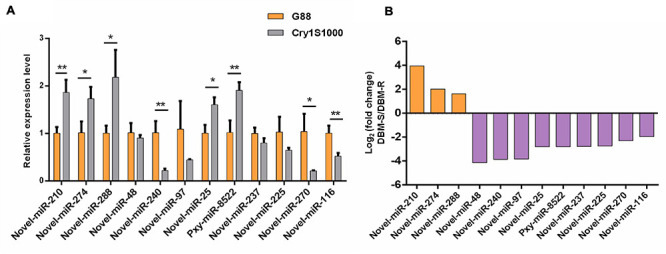
Relative expression levels of differentially expressed miRNAs in midguts of the resistant (Cry1S1000) and susceptible (G88) strains by RT-qPCR (A), and up-/down-regulated expression of the miRNAs based on Illumina sequencing (B). The expression levels of miRNAs were normalized by U6. Statistical significance was analyzed using one-way ANOVA. The asterisks represent significance, where two asterisks indicate p < 0.01, and one asterisk indicates p < 0.05. (B) The orange column above the X-axis shows up-regulated miRNAs, while the purple column below the X-axis shows down-regulated miRNAs based on Illumina sequencing.