
FIGURE 8.
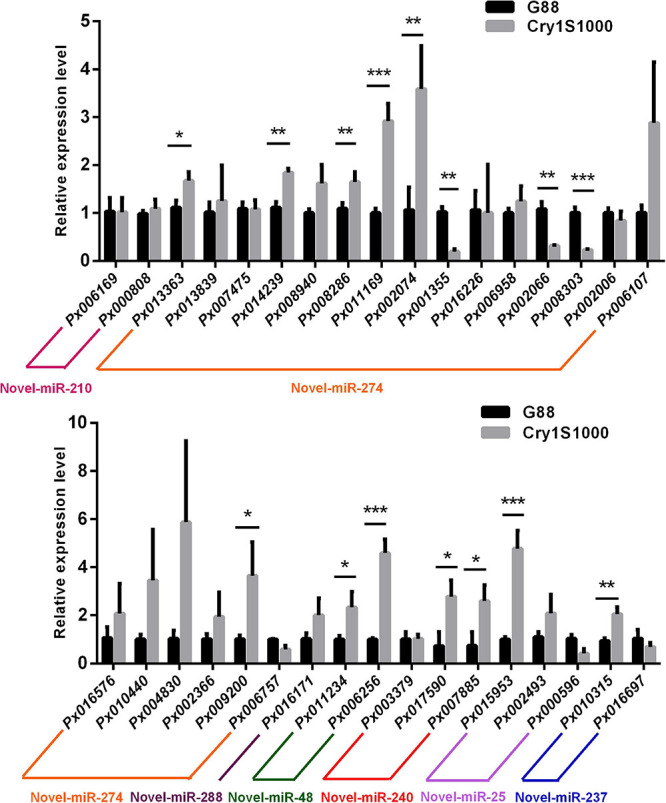
Relative expression levels of target genes in midguts of the resistant (Cry1S1000) and susceptible (G88) strains based on RT-qPCR. The expression levels of target genes were normalized by RPL32. Statistical significance was analyzed using one-way ANOVA. The asterisks represent significance, where three asterisks indicate p < 0.001, two asterisks indicate p < 0.01, and one asterisk indicates p < 0.05.