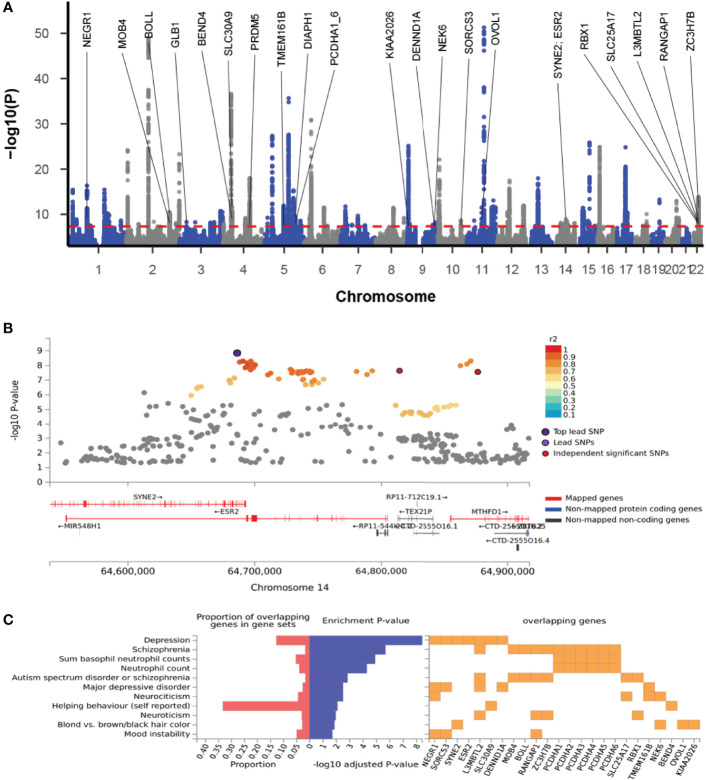
Figure 2.
Cross-trait meta-analysis of MDD and ADs. (A) Manhattan plot of meta-analysis of MDD with ADs. The x-axis is the chromosomal position of SNPs, and the y-axis is the significance of the SNPs (-log10P). Protein-coding genes containing or adjacent to independent significant SNPs shared by two traits were annotated. PCDHA1_6: PCDHA1, PCDHA2, PCDHA3, PCDHA4, PCDHA5, and PCDHA6. (B) The 14q23 locus containing the ESR2 gene. Each SNP is colored based on the highest r2 to one of the independent significant SNPs. (C) Enrichment of the 27 protein-coding genes in GWAS catalog gene sets.

