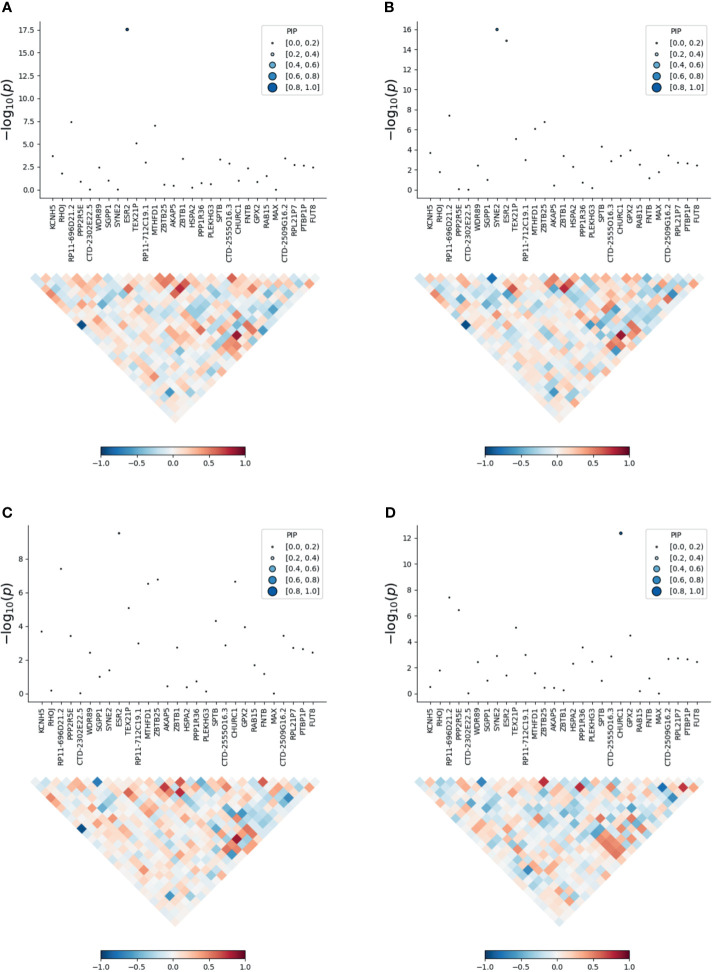
Figure 3.
Transcriptome-wide association study of the meta-analysis of MDD and ADs. (A) skin; (B) blood; (C) lung; (D) brain. Within each panel, the top part is the transcriptome-wide association signal indicating strength of the predicted expression association with trait, and the bottom part is the induced correlation of the predicted expression.

