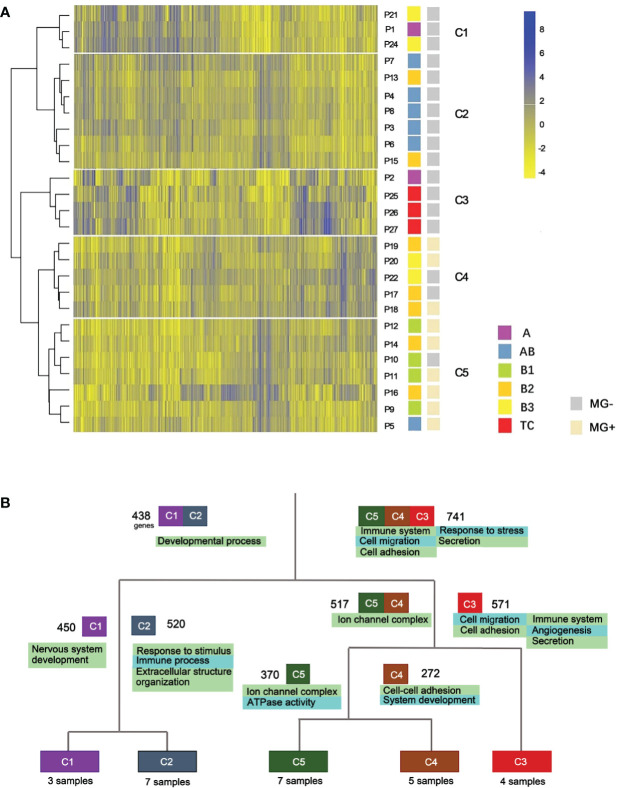
Figure 2.
Expression profile clustering of thymoma and thymic carcinoma. (A) Five clusters were established. C1-C5, different clusters; P, patient; MG, myasthenia gravis. (B) Gene function differences between thymic epithelial tumor types. Cluster-based differential expression analysis was performed. Four splits were used to separate the five clusters. Numbers besides the cluster boxes represent numbers of highly expressed genes.

