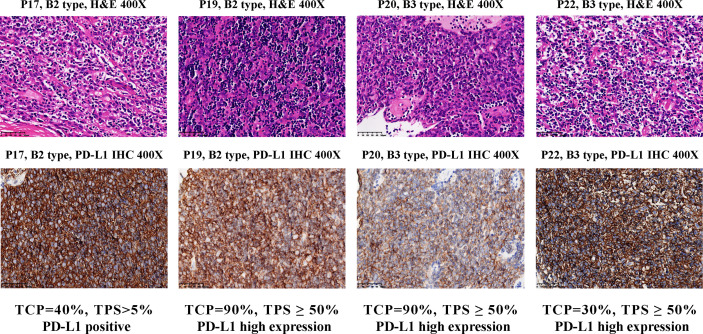
Figure 4.
PD-L1 IHC staining for B2 and B3 samples in the cluster C4. Top, hematoxylin and eosin (H&E) staining of the tissues. Bottom, IHC staining of PD-L1 in the cells using antibody 22C3 (Dako). Brown cells are PD-L1 staining cells. The H&E staining was used to estimate the tumor cell percentage (TCP). The expression level of PD-L1 protein is determined by the tumor proportion score (TPS), which is further divided into three types: ‘High expression’ (TPS ≥ 50%), ‘Positive’ (1% ≤ TPS < 50%) and ‘Negative’ (TPS < 1%).

