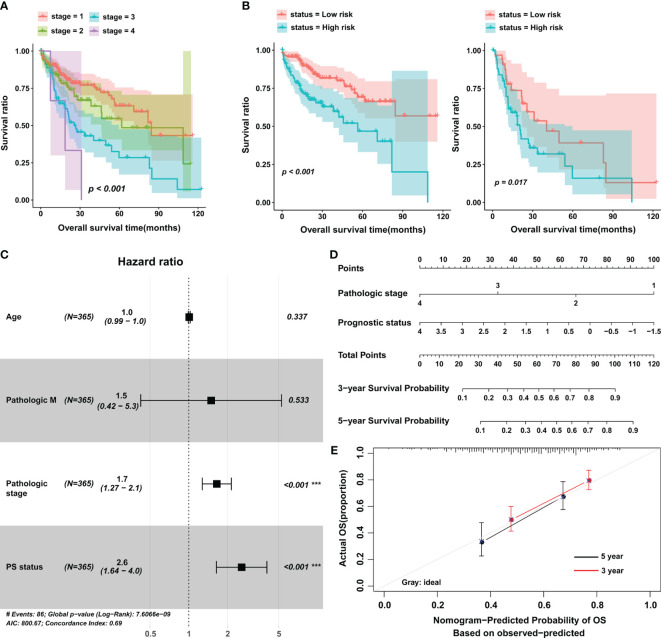
Figure 3.
The prognostic value of the eight-lncRNA signature in stratified analysis and construction of nomogram. (A) K-M curves were plotted to evaluate the OS probabilities for different pathological stages. (B) Stage I/II group (left) and stage III/IV group (right). (C) Multivariate Cox analysis in the training cohort. (D) Nomogram to predict the 3- and 5-year OS in patients with HCC. (E) Calibration curve for the nomogram model in the training cohort. The gray line represents the ideal nomogram, and the red line and black line represent the 3-year and 5-year observed nomograms. The horizontal axis represents the nomogram-predicted 5-year survival rate, and the vertical axis represents the actual 5-year survival rate. PS, prognostic score; OS, overall survival. ***p < 0.001.

