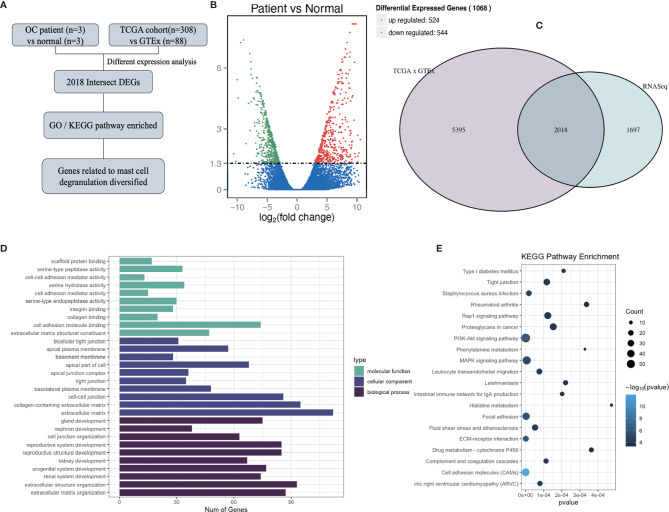
Figure 1.
Determination of genes differently expressed between normal ovarian tissue and ovarian cancer tissue. (A) Flow diagram of current bioinformatics research: a combination of RNA-Seq analysis and TCGA database. (B) Volcano plot of all genes differentially expressed between normal ovarian tissue (n = 3) and ovarian cancer tissue (n = 3), at a significance thresholds of |log2(Fold Change)| > 1, Padj<0.05. (C) Venn diagram of the results of the analyses of RNA-Seq and differently expressed genes (DEGs) in TCGA and GTEx. (D, E) GO (D) and KEGG (E) enrichment pathway analysis involving intersection DEGs.

