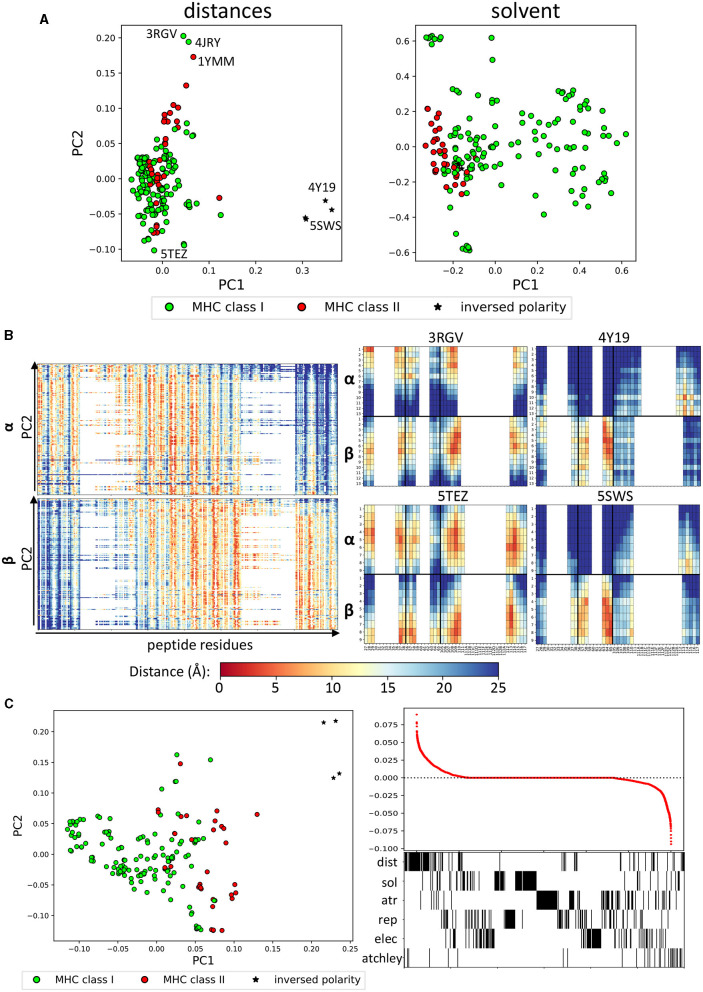
Figure 2.
Structural features identify different binding modes. (A) PCA performed on distances and on solvent energies can separate class I and class II complexes (green and red, respectively). The stars indicate the structures that have been reported to have inversed polarity (i.e., the TCRs bind the pMHC complex at 180° angle). Annotated on the distance plot, the structures at the extremes that we analyse in (B). (B) (Left) Linearised vectors used for the distance PCA, ordered according to their PC2 score. On the x-axis, the minimum distance between each CDR residue and each peptide residue (27-1, 28-1,…,116-1, 117-1, 27-2,…,117-20). (Right) Fingerprints for four representative structures labelled in (A) (3RGV high PC2, 5TEZ low PC2, 5SWS, and 4Y19 high PC1). (C) (Left) PCA of all feature sets combined, which also shows separation along PC1. (Right) Loading coefficient of each feature on PC1 and below a barcode to show which set the feature belongs to.

