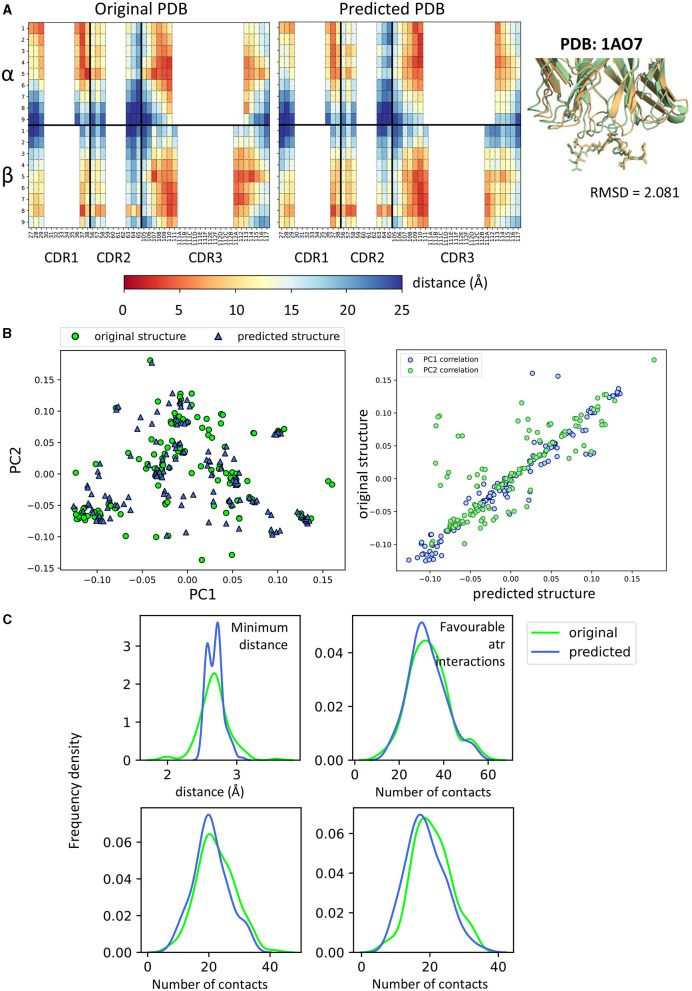
Figure 4.
Comparisons between crystal structures and homology predicted structures. (A) Comparison of fingerprint between the original 1AO7 structure and the one predicted by TCRpMHCmodels. On the right, figure showing how the two structures superimpose in cartoon form (green = original, gold = predicted). MHC not shown for clarity. (B) (Left) PCA on all feature sets showing the difference between crystal structures (green circles) and predicted structures (blue triangles). (Right) Correlation for PC1 and PC2 values between original and predicted structures. Each blue dot is a complex and has (x,y) coordinates that depend on PC1 values for predicted and original structure. Similarly for PC2 (green dots). PCA for other feature sets in Supplementary Figure 3. (C) Frequency distributions of four characteristics of the TCR-pMHC complexes comparing the distribution between original and predicted structures. Minimum distance: minimum distance between TCR and peptide; Contacts: number of TCR-peptide residue pairs that are <5A apart; Favourable atr/elec interactions: number of favourable (energy < 0) interactions between TCR and peptide.

