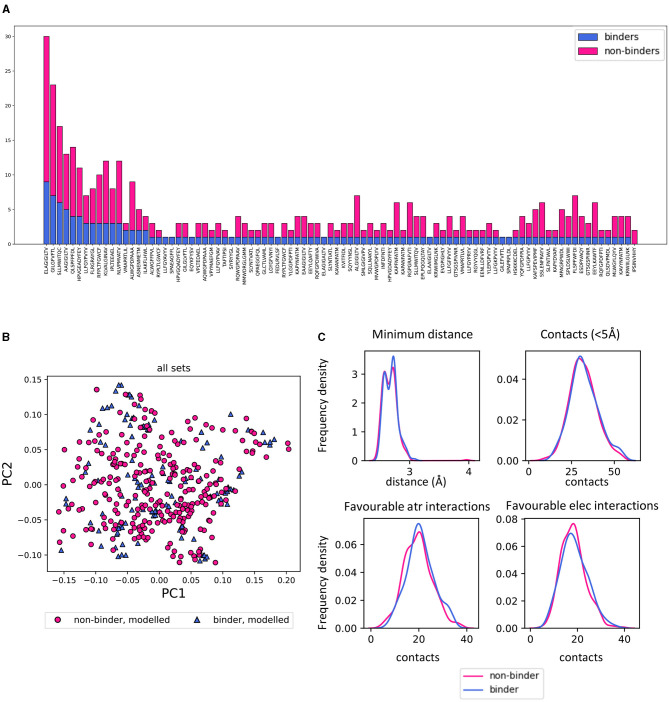
Figure 5.
Homology modelled binding and non-binding TCR-pMHC complexes can not be discriminated by PCA. (A) Summary of the number of STCRDab derived binding and non-binding structures which were modelled. For each peptide in the set, the barplot shows the number of models of binding and non-binding TCRs (blue and magenta, respectively). (B) PCA of all sets combined showing no separation between binding and non-binding TCR/pMHC homology models. The PCAs for each feature set separately are in Supplementary Figure 4. (C) Frequency distributions of 4 characteristics of the TCR-pMHC complexes comparing the distribution between binding and non-binding models. Minimum distance: minimum distance between TCR and peptide; Contacts: number of TCR-peptide residue pairs that are <5Å apart; Favourable atr/elec interactions: number of favourable (energy < 0) interactions between TCR and peptide.

