Figure 6.
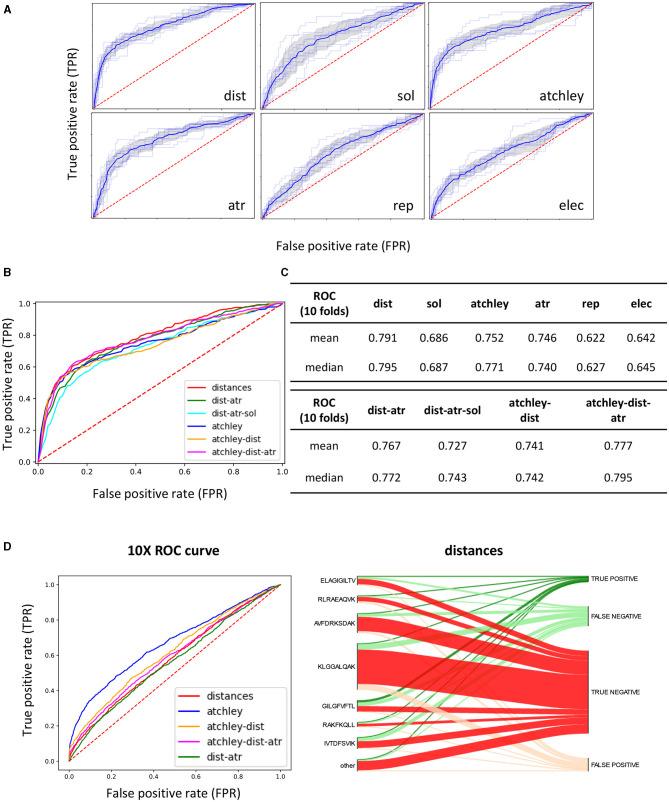
A discriminative classification model can be trained using extracted structural features. (A) ROC AUC curves of 10-fold CV on the STCRDab training set with each feature set separately. The faint lines are the results for each individual fold, whilst the dark lines represent the interpolated average results, with the shaded area as the standard deviation. (B) Interpolated ROC AUC curves for 10-fold CV obtained when combining different feature sets for prediction. (C) Tabular results for curves showed in (A,B). (D) (Left) ROC curves obtained when the model trained on the STCRDab set is used for prediction on the 10XGenomics validation set. (Right) For the model trained on STCRDab using the distance dataset only, the diagram shows which proportion of examples from each epitope are classified correctly (true positives and true negatives) or incorrectly (false positives and false negatives). This is shown in the form of a Sankey diagram, where from each epitope annotated on the left-hand side of the plot, a line is drawn for each TCR recognising that specific epitope to the final result for the complex (correctly classified as binder or non-binder, or incorrectly classified). The width of each section is proportional to the number of complexes that follow that classification.

