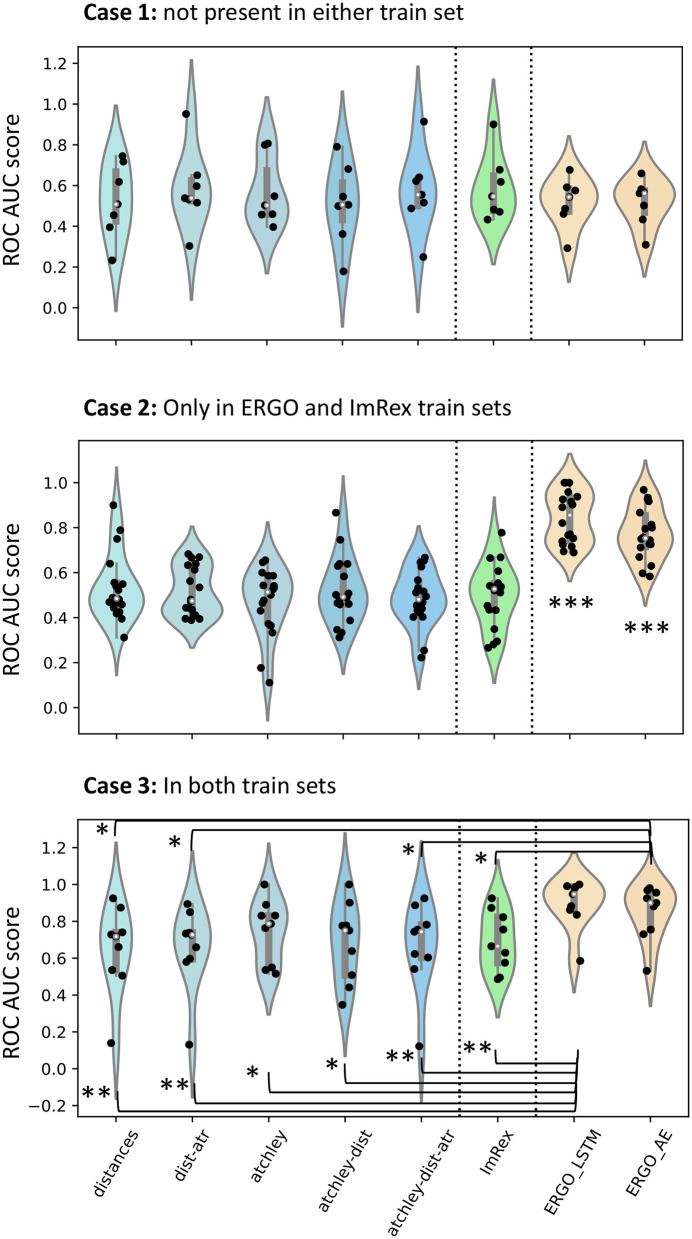
Figure 9.
Comparison of performance with other published tools. In each violin plot, a dot is an epitope for which performance is calculated. In Case 1, only epitopes that are not present in the PDB or in the VDJDb train sets are included. In Case 2, only epitopes that are present in the VDJDb but not in the PDB are included. In Case 3, only epitopes which are in both training sets are included. To look for differences, a Mann-Whitney U-test was calculated and significance values are shown: *p < 0.05; **p < 0.01; ***p < 0.001.

