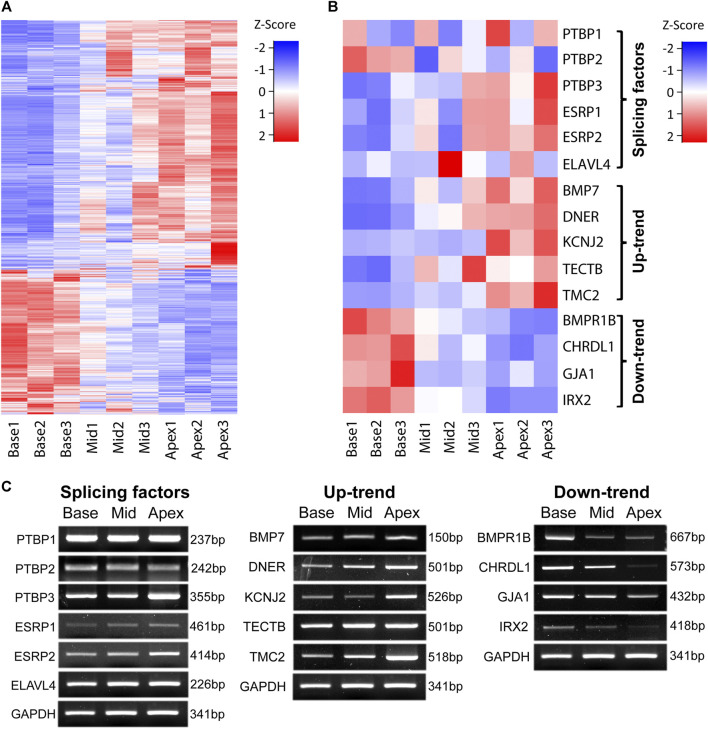
FIGURE 2.
Expression patterns along the tonotopic axis. Gene expression patterns of genes along the tonotopic axis are shown (A) Expression patterns of all Up-trend and Down-trend genes. FPKM values of each gene are used for z-score normalization. (B) Expression patterns of validated genes in three different categories. FPKM values of each gene are used for z-score normalization. (C) RT-PCR images of the selected genes in each category. GAPDH is used as the internal control.

