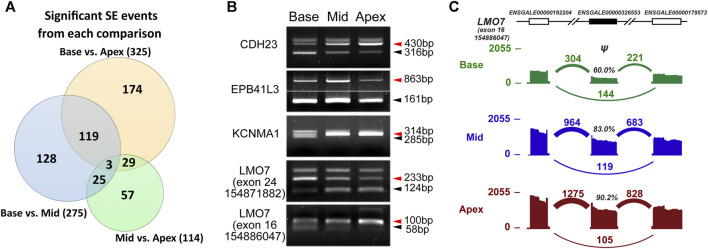
FIGURE 3.
Comparison of AS profiles along the tonotopic axis. (A) Number of significant skipped exon (SE) events from each comparison at FDR <5% and |Δψ| ≥ 5%. (B) RT-PCR–based exon inclusion levels of five tonotopic signature exons. (C) A skipped exon event of the LMO7 gene reported by rMATS (the last event in B) is shown with its flanking exons. Histograms represent exon read density and arcs represent splice junctions with the number of reads mapped to the junction indicated by the thickness of the arc. Both splice junction counts and exon read counts indicate that the target exon (solid) usage increases along the tonotopic axis.

