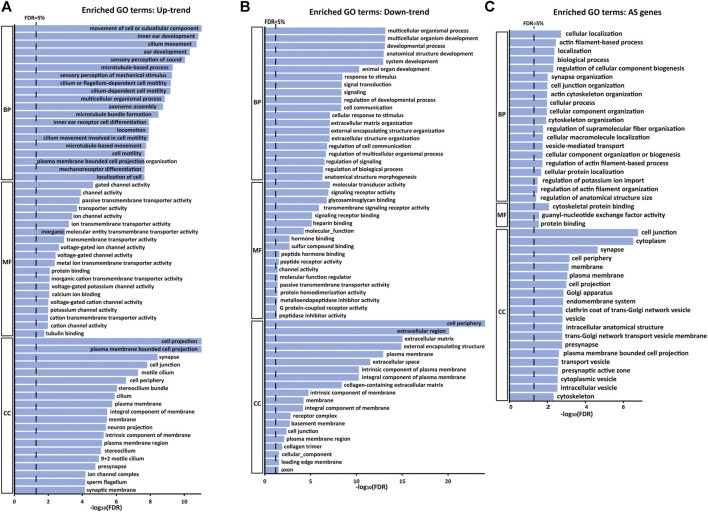
FIGURE 4.
GO enrichment analysis of Up-trend genes, Down-trend genes, and differential exon skipping events. Up to top 20 significant GO terms (FDR <5%) in the GO biological processes (BP), molecular functions (MF) and cellular components (CC) categories are listed in the bar graph (A) Enriched GO terms with Up-trend genes. (B) Enriched GO terms with Down-trend genes. (C) Enriched GO terms with AS genes.

