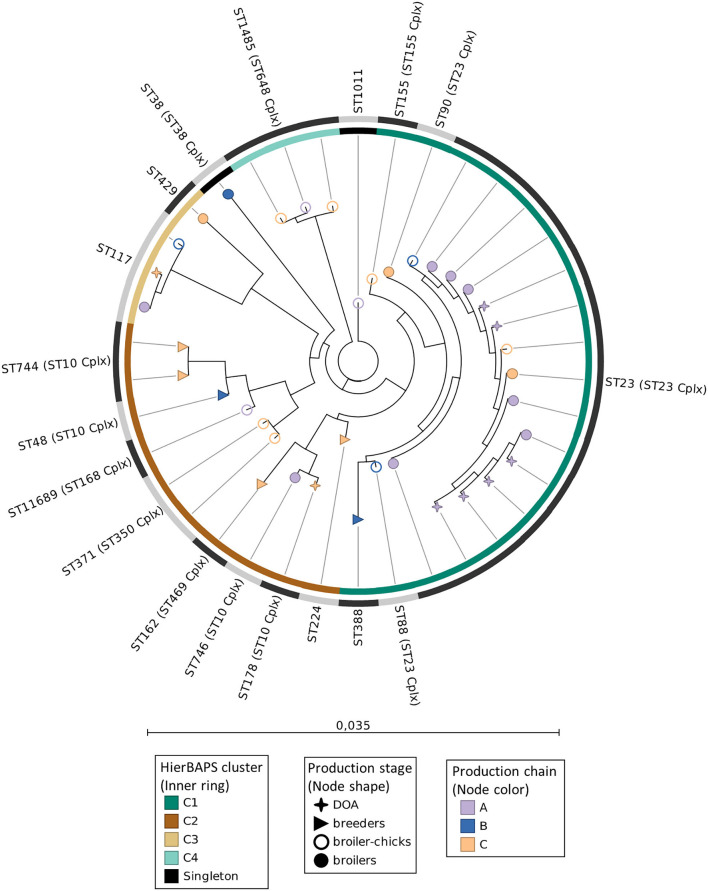
Figure 2.
Maximum-likelihood phylogeny of APEC MLST sequences. Nodes' shape and color indicate the broiler production stage and production chain, respectively. The inner ring specifies the hierBAPS clusters. The outer ring with alternating dark and light gray segments, marks different STs. Scale bar refers to the branch lengths, which are measured in the number of substitutions per site.

