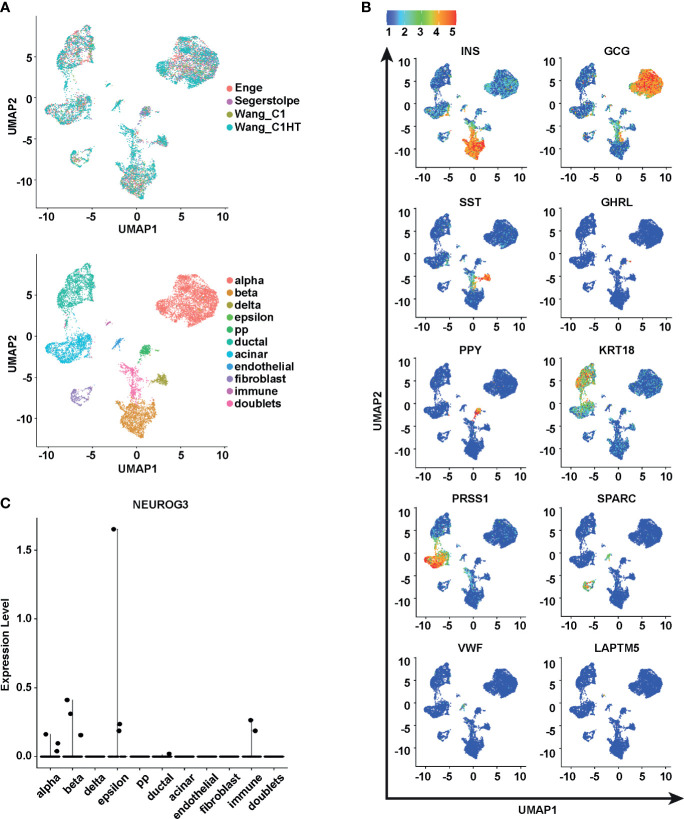
Figure 1.
The identification of NEUROG3+ cells from 11,174 postnatal human pancreatic cells. (A) Uniform Manifold Approximation and Projections (UMAPs) are used to visualize the single-cell RNA-seq data post alignment. Top panel, cells are colored according to their study sources. Bottom panel, cells are colored according to cell types. (B) Relative expression of known pancreatic cell-type markers. The color scale is based on normalized expression values of transcripts in each UMAP panel. (C) Scatter plot exhibits the expression levels of NEUROG3 in different populations.

