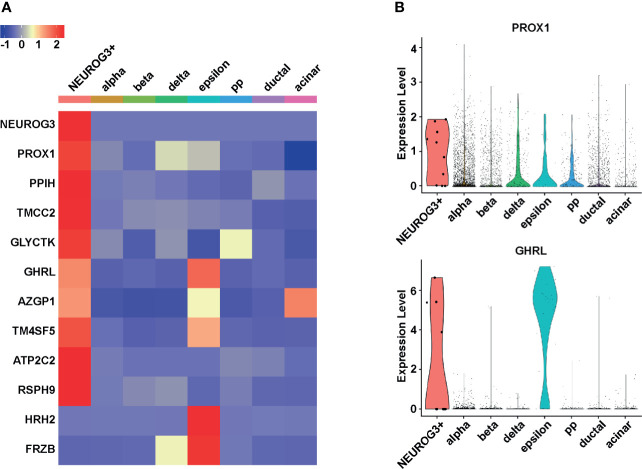
Figure 2.
NEUROG3+ cells have unique gene expression signatures. (A) Heatmap demonstrates the average expression of the 10 most upregulated and two most downregulated transcripts in NEUROG3+ cells compared to other pancreatic epithelial cell types. The color scale is based on the normalized Z-score of each transcript. (B) Violin plots display the expression levels of PROX1 and GHRL in different cell populations. Each dot represents one cell.

