Figure 3.
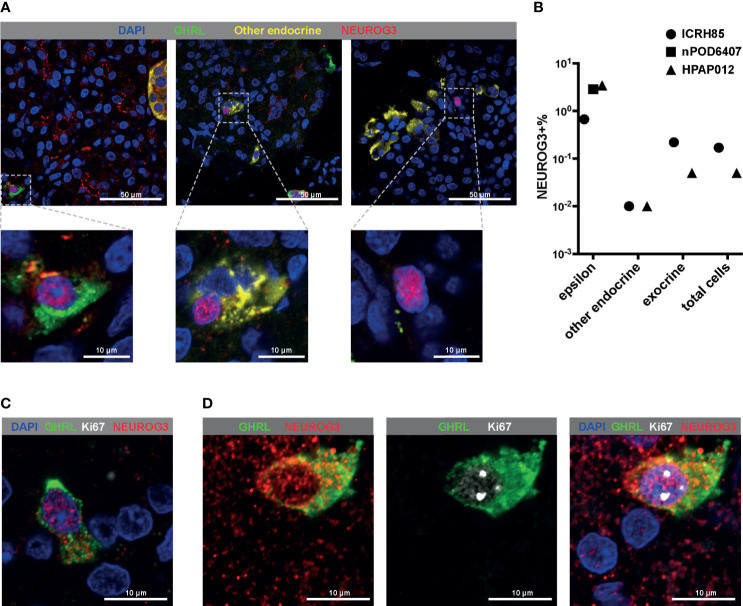
Immunofluorescent staining confirms the high frequency of NEUROG3 expression within epsilon cells. (A, C, D) All images shown are a single confocal Z-section. (A) Representative images showing the positive nuclear labeling of NEUROG3 in epsilon cells (left panel), other endocrine cells (middle panel) and exocrine cells (right panel) in postnatal human pancreatic tissue sections. Zoomed-in views of boxed regions are shown at the bottom of each panel. Color channels are: DAPI, blue; GHRL, green; INS+GCG+SST (a combination of three antibodies against individual proteins), yellow; NEUROG3, red. (B) Quantifications of NEUROG3+ cells in different populations. All cells from each section of the donor tissues were counted. Each data point represents aggregated results from one donor. “Other endocrine” corresponds to beta (INS+) or alpha (GCG+) or delta (SST+) cells. (C, D) Co-labeling of GHRL, NEUROG3 and Ki67. (C) The majority of NEUROG3+ cells are not proliferating. (D) in rare instances, coexpression of Ki67 and NEUROG3 can be observed. Color channels are: DAPI, blue; GHRL, green; Ki67, white; NEUROG3, red.

