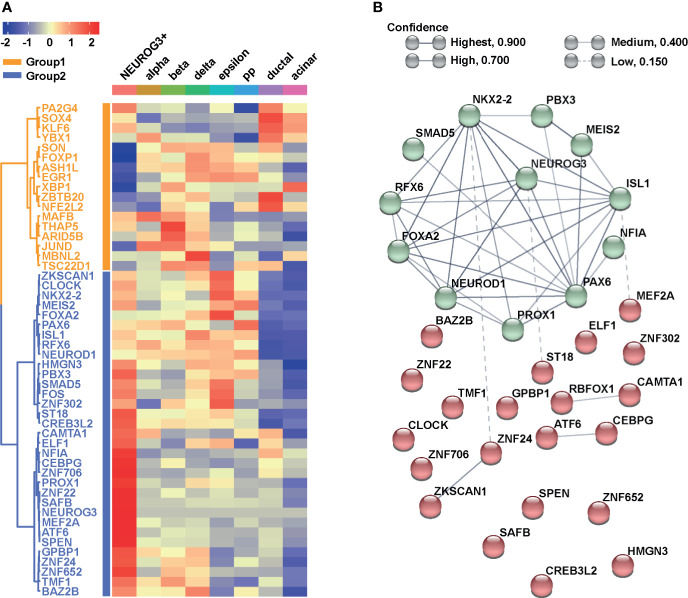
Figure 4.
NEUROG3+ cells contain an organized transcriptional network. (A) Heatmap presents the average expressions of the top 50 transcription factors (TFs) expressed in NEUROG3+ cells compared with other cell types, along with hierarchical clustering. (B) STRING analysis displays connectivity of Group 2 TFs. Nodes are colored based on their k-mean cluster memberships. The thickness of connection lines is reflective of the strength of data supporting the interactions.

