Figure 4.

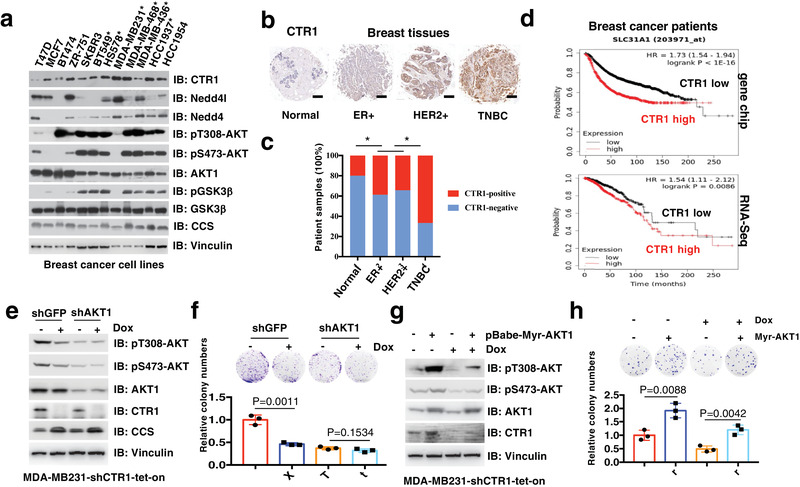
CTR1 is aberrantly expressed in breast cancer. a) IB analysis of WCL derived from a panel of breast cancer cell lines. Triple‐negative breast cancer cell lines were labeled with asterisk. The relative levels of CTR1 and pT308‐AKT were normalized with Vinculin or AKT1 respectively with the image J software. b) Image represented the CTR1 expression in different breast tissues detected with immunohistochemistry (IHC). c) The relative expression of CTR1 in different types of breast cancer were calculated and analyzed. *p < 0.05 (Chi‐square analysis). d) CTR1 expression in breast cancers derived from gene chip or RNA‐Seq database was analyzed and Kaplan–Meier plot for the survival of breast cancer patients was drawn via the website tool (http://kmplot.com/). Red curve indicates the high expression of CTR1, black curve indicates the low expression of CTR1 with the optimized cutoff. e,f) AKT1 knockdown and WT MDA‐MB231 cells were infected with tet‐on inducible shRNAs against CTR1, and selected with puromycin (1 µg mL−1) for 5 days. Resulting cells were treated with doxycycline (1 µg mL−1) for 48 h and subject for IB analysis (e), colony formation assays (f, top panel). The relative colony numbers were normalized and plotted (f, bottom panel) (mean ± SD, n = 3; t‐test). g,h) Myr‐AKT1 stably expressing and control MDA‐MB231 cells were infected with tet‐on inducible shRNAs against CTR1, and selected with puromycin (1 µg mL−1) for 5 days. Resulting cells were treated with doxycycline (1 µg mL−1) for 48 h and subject for IB analysis (g), colony formation assays (h, top panel). The relative colony numbers were normalized and plotted (h, bottom panel) (mean ± SD, n = 3; t‐test).
