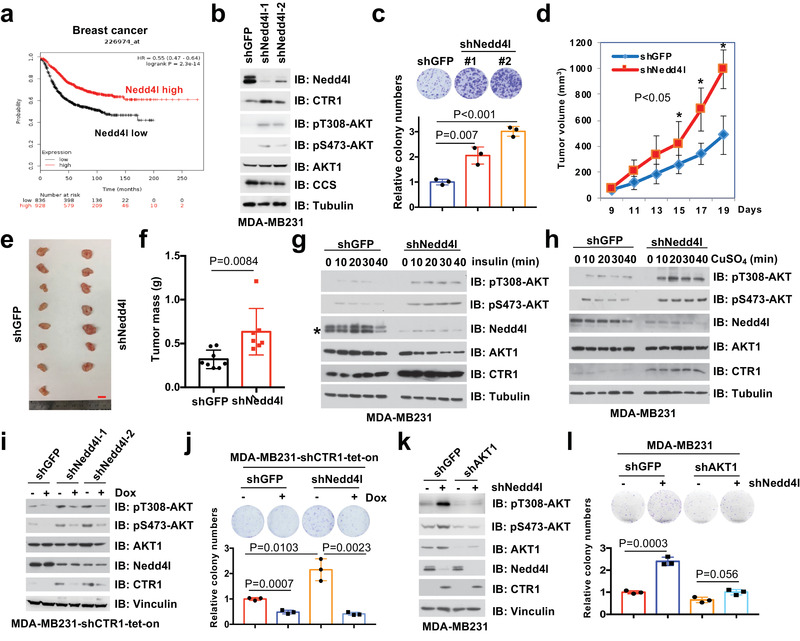
Figure 6.

Nedd4l negatively regulates AKT kinase activity and executes tumor suppressor function largely by targeting CTR1 for ubiquitination‐mediated degradation. a) Nedd4l expression in breast cancer was analyzed and the Kaplan–Meier plot was drawn via a website tool (http://kmplot.com/). b,c) IB analysis of WCL derived from MDA‐MB231 cells infected with shRNAs against NEDD4L (b). Resulting cells were subjected for colony formation assays (c, top panel). Relative colony numbers were normalized and plotted (c, bottom panel) (mean ± SD, n = 3; t‐test). The cells generated in (b), were subjected to xenograft assays (5 × 10⁶ cells for injection). d) The mice were sacrificed once the tumors reached around 1.5 cm, and the tumor size was monitored (mean ± SD, n = 8; *p < 0.05, **p < 0.01, t‐test). The tumors were e) dissected and f) weighed (mean ± SD, n = 8; t‐test). Bar indicates 10 mm. MDA‐MB231 cells were infected with shRNAs against NEDD4L (shGFP was used as a negative control) and selected with puromycin (1 µg mL−1) for 72 h. Resulting cells were treated with g) insulin (0.1 µm) or h) copper (20 µm) in different time courses after serum‐starved for 12 h. Asterisk indicates the lower band as the major Nedd4l band. i,j) MDA‐MB231 cells were infected with shRNA against NEDD4L, selected with puromycin (1 µg mL−1) for 72 h, infected with tet‐on inducible shRNAs against CTR1, selected with puromycin (2 µg mL−1) for 5 days, and treated with or without doxycycline (1 µg mL−1) for 24 h before harvesting for IB analysis. Resulting cells generated from (i) were subjected to colony formation assays (j, top panel). The relative colony numbers were normalized and plotted (j, bottom panel) (mean ± SD, n = 3; t‐test). k,l) MDA‐MB231 cells were infected with shRNAs against NEDD4L and AKT1 respectively, and selected with puromycin (1 µg mL−1) for 72 h for IB analysis (k). shGFP was used as a negative control. Resulting cells were subjected for colony formation assays (l, top panel). The relative colony numbers were normalized and plotted (l, bottom panel) (mean ± SD, n = 3; t‐test).
