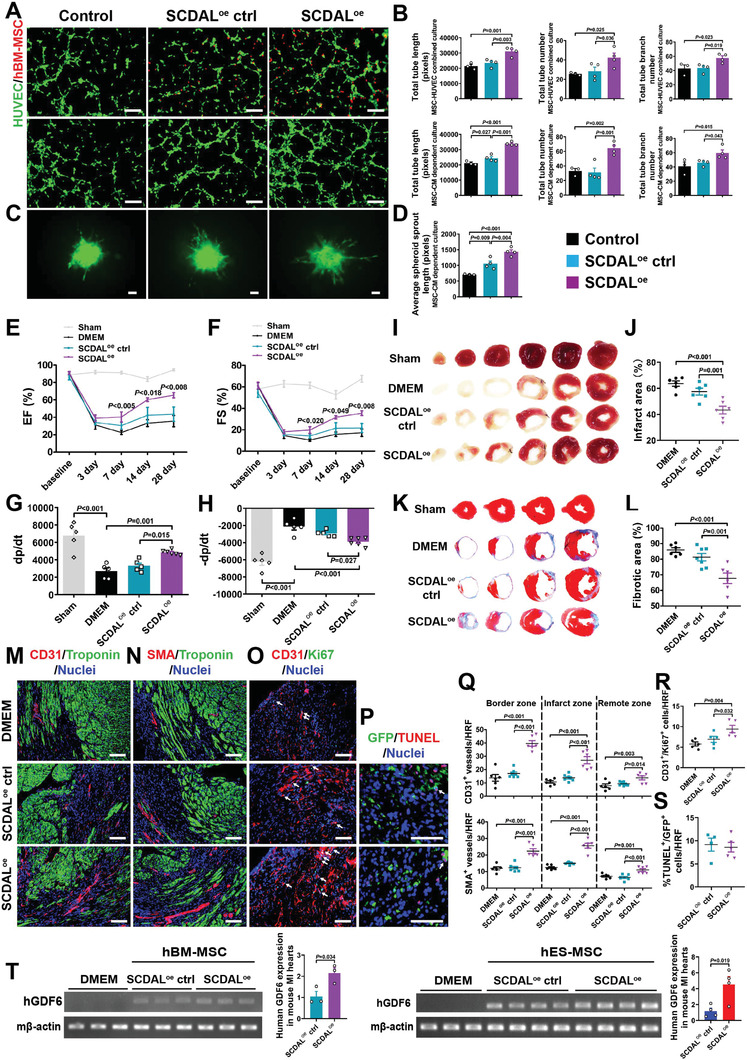
Figure 7.

The biological function of SCDAL in mediating the angiogenic potential of hBM‐MSCs. A,B) Representative images and quantification for total tube length, tube number, and tube branch number of HUVEC tube formation (green) cocultured with SCDAL oe hBM‐MSCs (red, top panels) or their supernatants (middle panels) as compared to controls (n ≥ 3). Scale bar, 200 µm. C,D) Representative images and quantification for average HUVEC spheroid sprout length after cocultured with SCDAL oe hBM‐MSC‐conditioned supernatants as compared to control groups (n ≥ 3). Scale bar, 200 µm. E–H) Echocardiographical and hemodynamic assessments of EF, FS, and ±dp/dt in Sham (n ≥ 5), DMEM (n = 5), SCDAL oe ctrl hBM‐MSC (n = 5), and SCDAL oe hBM‐MSC (n = 6)‐receiving mice. I–L) TTC staining and Masson's trichrome staining on serial heart sections four weeks post MI with corresponding quantifications in Sham, DMEM (n = 6), SCDAL oe ctrl hBM‐MSC (n ≥ 6), and SCDAL oe hBM‐MSC (n = 6)‐receiving mice. M,N,Q) Representative border zone images and quantification for CD31+ and SMA+ vessels in DMEM (n = 6), SCDAL oe ctrl hBM‐MSC (n = 7), and SCDAL oe hBM‐MSC (n = 6)‐receiving mice 28 days after MI. Scale bar, 100 µm. O,R) Representative images and quantification for CD31+/Ki67+ cells (white arrows) in DMEM (n = 5), SCDAL oe ctrl hBM‐MSC (n = 5), and SCDAL oe hBM‐MSC (n = 5)‐treated hearts at 3 days post‐MI. Scale bar, 100 µm. P,S) Representative images and quantification for TUNEL+/GFP+ cells (white arrows) in different hBM‐MSC (n ≥ 4)‐treated hearts three days after transplantation. Scale bar, 100 µm. HRF, high resolution field. T) Semi‐quantitative RT‐PCR and qRT‐PCR detection of human GDF6 expression in DMEM (n = 3), SCDAL oe ctrl hBM‐MSC/hES‐MSC (n ≥ 3), and SCDAL oe hBM‐MSC/hES‐MSC (n ≥ 3)‐treated hearts at 3 days post infarction. Mouse β‐actin is used as a loading control. All bars in (B), (D–H), (J), (L), and (Q–T) represent mean ± SEM ((B), (D–H), (J), (L), and (Q–R), One‐way ANOVA, LSD, S‐N‐K, and Waller–Duncan analysis; (S) and(T), unpaired Student's t‐test).
