
Figure 1.
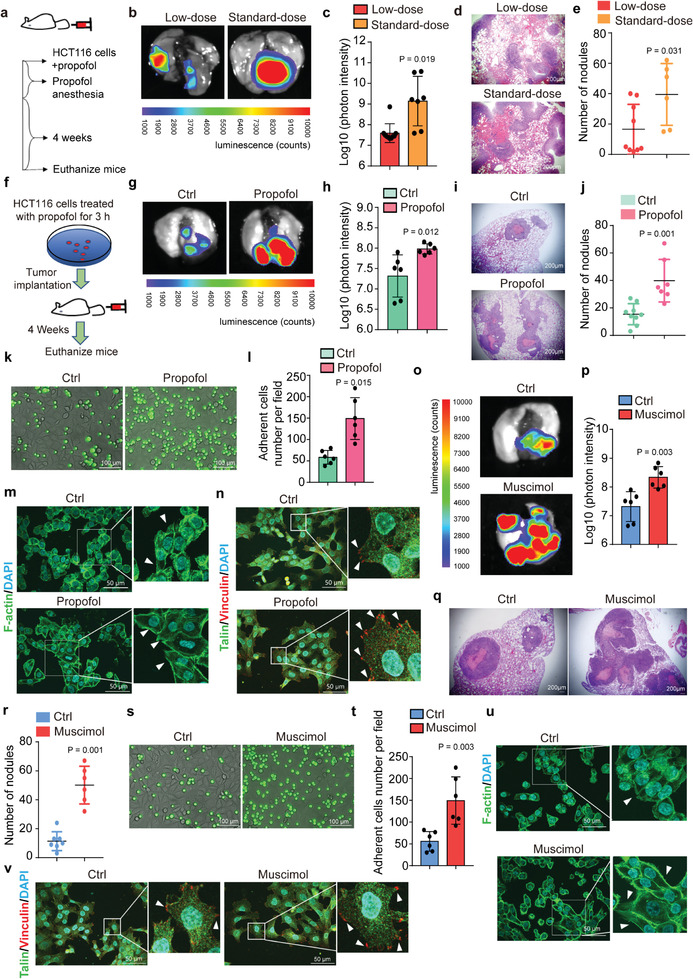
Propofol and GABAAR agonist muscimol promote tumor metastasis in the lungs of mice by enhancing tumor cell adhesion and extension. a) Study diagram: Injection of HCT116 cells overexpressing luciferase was followed by injection of low‐dose or standard‐dose propofol into the tail vein of BALB/c nude mice. b) Tumor metastasis in lungs of mice injected with low‐ versus standard‐doses of propofol, by ex vivo bioluminescent assay. c) Quantification of bioluminescent photon intensity (N = 10 in low‐dose group, N = 7 in standard‐dose group; mean ± SD, Student's t‐test, P = 0.019). d) H&E staining of metastatic lung nodules (scale bar = 200 µm). e) Quantification of metastatic nodules (N = 9 in low‐dose group, N = 6 in standard‐dose group; median and IQR, Mann–Whitney test, P = 0.031). f) Study diagram: HCT116 cells overexpressing luciferase were treated with propofol for 3 h (mimicking average clinical anesthesia time) and were injected intravenously into BALB/c nude mice. g) Ex vivo bioluminescent assay comparing lung metastasis of mice injected with propofol‐treated or DMSO‐treated (nonanesthesia control condition) cells. h) Quantification of bioluminescent photon intensity (N = 6 in each group; mean ± SD, Student's t‐test, P = 0.012). i) H&E staining of metastatic lung nodules (scale bar = 200 µm). j) Quantification of metastatic nodules (N = 9 in ctrl group, N = 7 in propofol group; median and IQR, Mann–Whitney test, P = 0.001). k) Fluorescent micrographs showing adhesion of propofol‐treated or DMSO‐treated HCT116 cells (green) to the HUVEC monolayer (scale bar = 100 µm). l) Quantification of the HCT116 cells adhesion to the HUVEC monolayer under static conditions (N = 6, mean ± SD, Student's t‐test, P = 0.015). m) F‐actin labeling of cell membrane protrusions in propofol‐treated or control HCT116 cells (F‐actin: phalloidin; nucleus: DAPI; scale bar = 50 µm). Arrows indicate cell membrane protrusion extensions. n) Immunofluorescence staining of focal adhesion proteins Talin and Vinculin in propofol‐treated HCT116 cells compared to control cells (scale bar = 50 µm). Arrows indicate focal adhesions. o) Ex vivo bioluminescent assay of lung metastasis of mice injected with muscimol‐treated cells compared to control cells. p) Quantification of bioluminescent photon intensity (N = 6 in each group; mean ± SD, Student's t‐test, P = 0.003). q) H&E staining of metastatic nodules (scale bar = 200 µm). r) Quantification of metastatic nodules (N = 7 in ctrl group, N = 6 in muscimol group; median and IQR, Mann–Whitney test, P = 0.001). s) Fluorescent micrographs showing adherence of HCT116 cells (green) treated with muscimol or control conditions to the HUVEC monolayer (scale bar = 100 µm). t) Quantification of the HCT116 cells adhesion to an HUVECs monolayer (N = 6, mean ± SD, Student's t‐test, P = 0.003). u) F‐actin labeling of cell extensions in HCT116 cells treated with muscimol compared to controls (F‐actin: phalloidin; nucleus: DAPI; scale bar = 50 µm). Arrows indicate cell membrane protrusion extensions. v) Immunofluorescence staining of Talin and Vinculin in HCT116 cells treated with muscimol or controls (scale bar = 50 µm). Arrows indicate focal adhesions. Ctrl, control; HUVEC, human umbilical vein endothelial cell; H&E, hematoxylin and eosin; SD, standard deviation.