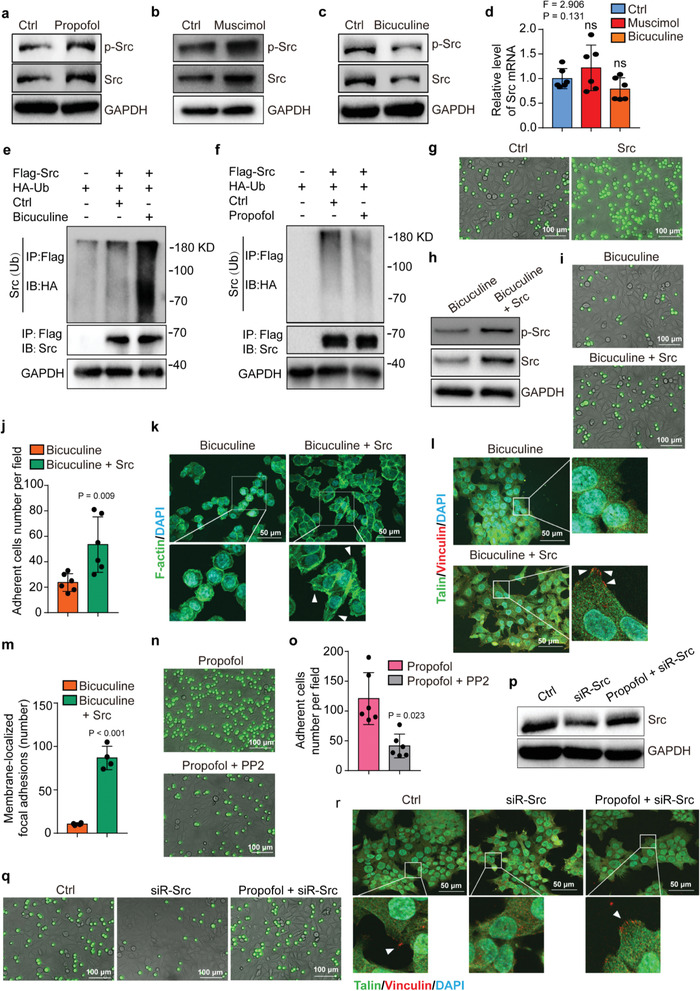
Figure 2.

Propofol enhances adhesion and extension of HCT116 cells through GABAAR‐dependent Src expression. Western blot analysis of Src and p‐Src expression in HCT116 cells treated with a) propofol, b) muscimol, or c) bicuculine. GAPDH is a loading control. d) qRT‐PCR results for Src mRNA levels in HCT116 cells treated with muscimol, bicuculine, or control conditions (N = 6 in each group, mean ± SD, one‐way ANOVA test with post‐hoc Bonferroni test, F = 2.906, P = 0.131). Western blot analysis of Src ubiquitylation in HCT116 cells overexpressing Src‐Flag or control vector and treated with e) bicuculine or f) propofol compared to control condition. Src was immunoprecipitated with anti‐Flag and immunoblotted with anti‐HA. g) Fluorescent micrographs showing adhesion between the HUVEC monolayer and the HCT116 cells (green) with or without Src overexpression (scale bar = 100 µm). h) Western blot analysis of Src and p‐Src expression in bicuculine‐treated HCT116 cells with or without Src overexpression. GAPDH is a loading control. i) Fluorescent micrographs showing adhesion between HUVEC monolayer and the bicuculine‐treated HCT116 cells (green) with or without Src overexpression (scale bar = 100 µm). j) Quantification of the HCT116 cell adhesion to the HUVEC monolayer (N = 6, mean ± SD, Student's t‐test, P = 0.009). k) F‐actin labeling of membrane protrusions in bicuculine‐treated HCT116 cells with or without Src overexpression (scale bar = 100 µm). Arrows indicate extensions of cell membrane protrusions. l) Immunofluorescence staining of Talin and Vinculin in the bicuculine‐treated HCT116 cells with or without Src overexpression (scale bar = 50 µm). Arrows indicate focal adhesions. m) Quantification of the membrane‐localized Talin and Vinculin in focal adhesions (N = 4, mean ± SD, Student's t‐test, P < 0.001). n) Fluorescent micrographs showing adhesion between the HUVEC monolayer and the propofol‐treated HCT116 cells (green) with or without Src inhibitor PP2 treatment (scale bar = 100 µm). o) Quantification of panel (n) (N = 6, mean ± SD, Student's t‐test, P = 0.023). p) Western blot analysis of Src expression following RNAi knockdown of Src in HCT116 cells treated with propofol or control condition. GAPDH is a loading control. q) Fluorescent micrographs showing adhesion between the HUVEC monolayer and the HCT116 cells with knockdown of Src (green) treated with propofol or control condition (scale bar = 100 µm). r) Immunofluorescence staining of Talin and Vinculin in HCT116 cells with knockdown of Src treated with propofol or control condition (scale bar = 50 µm). Arrows indicate focal adhesions. Ctrl, control; HUVEC, human umbilical vein endothelial cell; SD, standard deviation; p‐Src, phosphorylated Src.
