Figure 3.

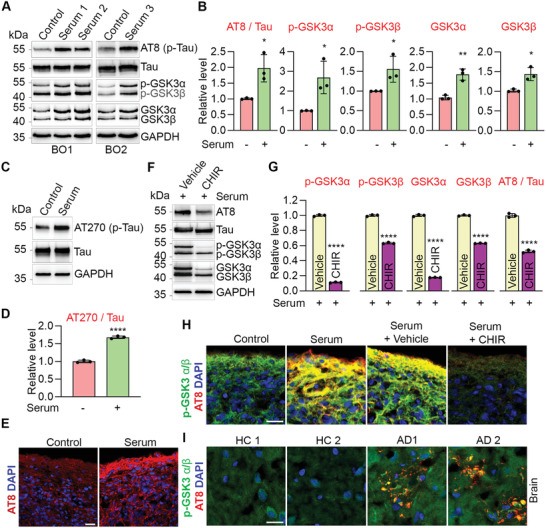
Serum exposure induces p‐Tau through GSK3α/β. A) Western blot of p‐Tau (AT8), Tau, p‐GSK3α/β, GSK3α/β and GAPDH in BOs treated without (control) or with serum. Each lyaste was from pooled 3–5 individual BOs. B) Quantification of p‐Tau (AT8), p‐GSK3α, p‐GSK3β, GSK3α, and GSK3β levels. p‐Tau was normalized to total Tau and the others were normalized to GAPDH. n = three experiments in BO1 and BO2. C) Western blot of p‐Tau (AT270), Tau and GAPDH in control and serum‐treated BO1. Each lyaste was from pooled 3–5 individual BOs. D) Quantification of p‐Tau (AT270) level and normalized to total Tau. n = 3 quantitative repeats. E) Immunostaining for p‐Tau (AT8) in control and serum‐treated BO2. F) Western blot of p‐Tau (AT8), Tau, p‐GSK3α/β, GSK3α/β and GAPDH in BO2 treated with vehicle, or GSK3α/β inhibitor CHIR99021 (CHIR) under serum exposure. G) Quantification of p‐GSK3α/β, GSK3α/β and p‐Tau (AT8) levels. p‐Tau (AT8) was normalized to total Tau and the others were normalized to GAPDH. n = 3 quantitative repeats. H) Immunostaining for p‐Tau (AT8) and p‐GSK3α/β in BO2 treated with vehicle control, serum, serum plus vehicle or serum plus CHIR treatment. I) Immunostaining for p‐Tau (AT8) and p‐GSK3α/β in cortex of AD patients and healthy controls (HC). E,H,I) Scale bar, 20 µm. B,D,G) Error bars are SD of the mean; *p < 0.05, **p < 0.01, and ****p < 0.0001 by unpaired two‐tailed t‐test.
