Figure 6.

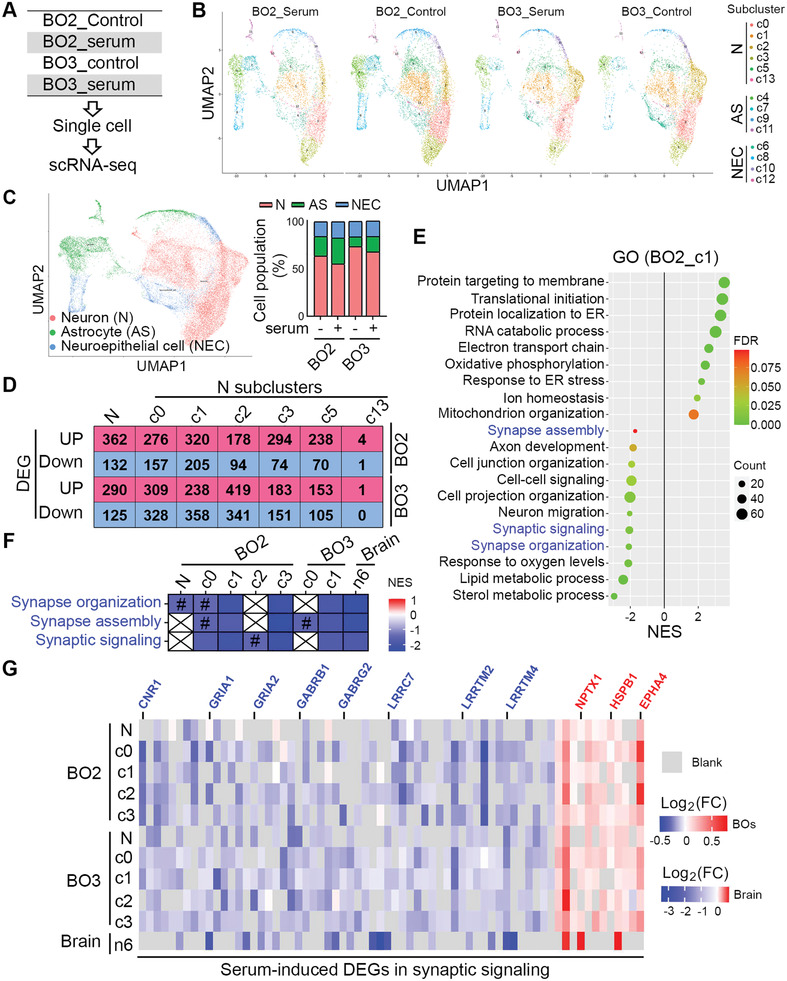
Serum exposure reduced synaptic function in neurons of brain organoids revealed by scRNA‐seq. A) Schematics of scRNA‐seq of BOs treated without (control) and with serum for 13–14 days. Single cells of each group were from pooled 3–5 individual BOs. B) UMAP visualization showing subcluster of neurons (N), astrocytes (AS) and neuroepithelial cells (NEC) in BO2 and BO3. C) UMAP visualization showing clustering of single cell colored by cell types. The composition of cells is shown in each sample. D) Number of differentially expressed genes (DEGs) in neurons (N) and neural subclusters that were up‐ or down‐regulated in serum‐treated BOs. E) GSEA result (Gene Ontology, GO) using DEGs of neural c1 subcluster in BO2. p‐Value < 0.05. F) Three GO categories related to synaptic function are shown in neuron and neural subclusters of BOs and AD cortex published by Grubman et al. Colored by NES value for each category. p‐value < 0.05 except labeled with #. #: p‐Value larger than 0.05 and less than 0.1. G) Neural DEGs involved in synaptic functions from both BOs (p‐value < 0.05) and AD cortex (FDR < 0.05) published by Grubman et al. Colored by Log2(FC) values. FC: fold change.
