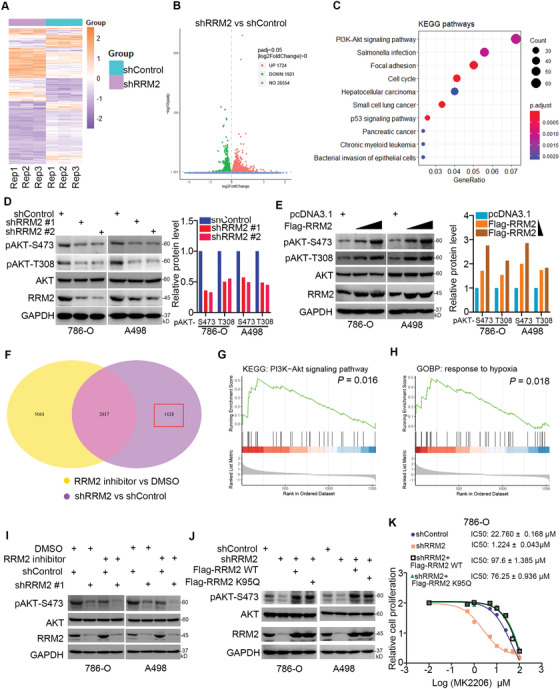
Figure 2.

RRM2 activates the AKT pathway independent of its enzymatic activity. A–C) 786‐O cells were infected with the indicated constructs for 72 h. Cells were subjected to RNA‐seq analysis (A and B) and subsequent KEGG pathway enrichment (C). D) 786‐O and A498 cells were infected with the indicated constructs for 72 h. Cells were harvested for Western blotting analysis. The protein level of pAKT‐S473 was quantified by Image J software. E) 786‐O and A498 cells were transfected with Flag‐RRM2 plasmids (5 and 15 ng) for 24 h. Cells were harvested for Western blotting analysis. The protein level of pAKT‐S473 was quantified by Image J software. F) 786‐O cells were treated with or without RRM2 inhibitors (COH29, 15 µm) for 24 h. Cells were subjected to RNA‐seq analysis. The Venn map showed that the genes changed after knockdown of RRM2 or treated with RRM2 inhibitors. G,H) KEGG enrichment analysis (G) and GOBP enrichment analysis (H) of 1628 genes in the RRM2 knockdown group independent of RRM2 inhibitor. p values are indicated in the figure. I) 786‐O and A498 cells were infected with the indicated constructs for 72 h. These cells were treated with or without 20 µm COH29 for another 24 h. Cells were harvested for Western blotting analysis. J) 786‐O and A498 cells were infected with the indicated constructs for 72 h. These cells were transfected with the indicated plasmids for 24 h. Cells were harvested for Western blotting analysis. K) 786‐O cells were pretreated with 20 µm COH29. These cells were infected with shControl or shRRM2 for 48 h. Then, the shRRM2 group cells were transfected with or without Flag‐RRM2 for 24 h. These cells were treated with a series of concentrations of sunitinib for 24 h. Cells viability was measured by MTS assay.
