
Figure 1.
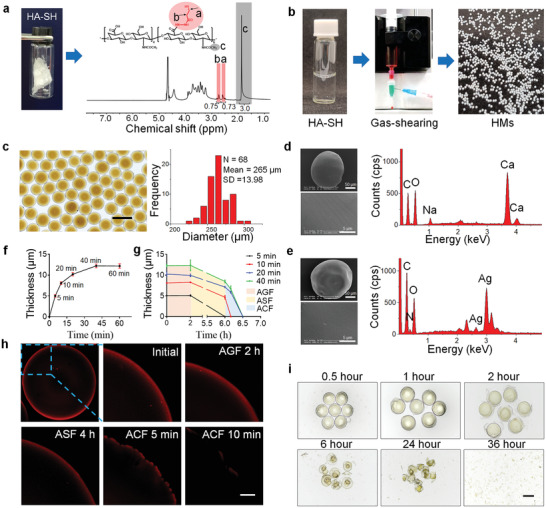
Synthesis of HA‐SH and Preparation of HAMs. a) A photograph (left) and a proton nuclear magnetic resonance spectrum (right) of HA‐SH. The substitution degree of the sulfhydryl group (≈37%) was determined by the integration of the methylene peaks (a and b, red shading) relative to the methyl group of HA (c, grey shading). b) The HA‐SH aqueous solution (left) was fabricated into the HMs (right) by utilizing a gas‐shearing device (middle). c) Optical image of the obtained HMs (top) and the size distribution of the microspheres (bottom). Scale bar 400 µm. d) Representative image of scanning electron microscopy and the elemental analysis of HMs. e) Representative image of scanning electron microscopy and the elemental analysis of HAMs. f) The thickness of the shell that formed by crosslinking alginate with calcium ion (Ca2+) changes with the length of dwell time (5, 10, 20, 40, and 60) in sodium alginate solution. g) The changes of shell thickness of microspheres in artificial gastric fluid (AGF, pH 1.0), artificial small intestine fluids (ASF, pH 6.8), and artificial colon fluid (ACF, pH 7.8). h) Representative images of the degradation process of alginate hydrogel shell (red) in AGF, ASF, and ACF successively. Scale bar 20 µm. i) HMs degrade slowly in the presence of hyaluronidase. Scale bar 200 µm.