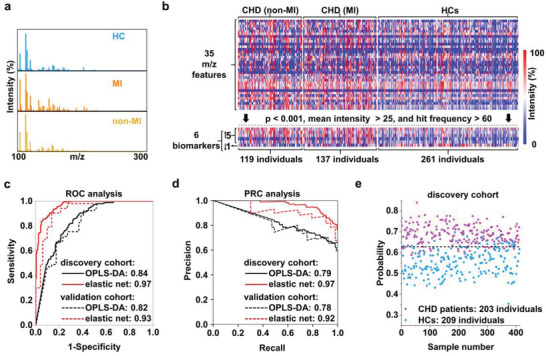
Figure 1.

SMPs for machine learning. a) Typical MS spectra within a m/z range from 100 to 300 obtained by NP‐assisted LDI of serum samples from a HC, a CHD patient with MI and a CHD patient without MI. b) SMPs for HCs and CHD (MI/non‐MI) patients. Each SMP contained 35 m/z features from which six biomarkers (p < 0.001, mean intensity > 25, and hit frequency > 60) were screened. Specifically compared to HCs, five biomarkers were up‐regulated and one biomarker was down‐regulated in CHD patients. c–e) Diagnostic performance of machine learning for stratification and prediction. c) Receiver operating characteristic curves and d) PRC analysis using OPLS‐DA (black) and sparse learning (elastic net analysis, red) to distinguish HCs from CHD patients. The solid and dashed lines showed the results from the discovery and validation cohorts, respectively. e) Stratification based on the predicted probability for CHD patients and HCs obtained by sparse learning (elastic net analysis) of SMPs in the discovery cohort. Blue and purple points represented HCs and CHD patients, respectively. The dashed lines in (e) indicated the machine learning‐derived thresholds with an optimized AUC to distinguish CHD patients from HCs.
