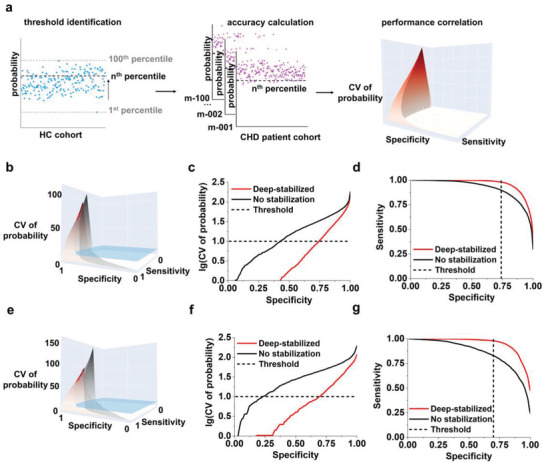
Figure 3.

Establishment of a diagnostic protocol for CHD. a) Schematic of the diagnostic protocol based on the SMPs and machine learning. The protocol implemented three major procedures to obtain the DVC surface (here named the MK surface): threshold identification, accuracy calculation, and performance correlation. Application of the protocol in the b–d) discovery cohort and e–g) validation cohort. b,e) A 3D model showing MK surfaces for the indicated cohort. The blue plane represented the threshold for a CV of 10%. The grey and red MK surfaces referred to the no stabilization and deep‐stabilized experiments, respectively. Projections of MK surfaces showing c,f) CV/specificity and d,g) sensitivity/specificity were shown. The dashed line indicated the threshold for a CV of 10% according to the guidelines.
