
Figure 6.
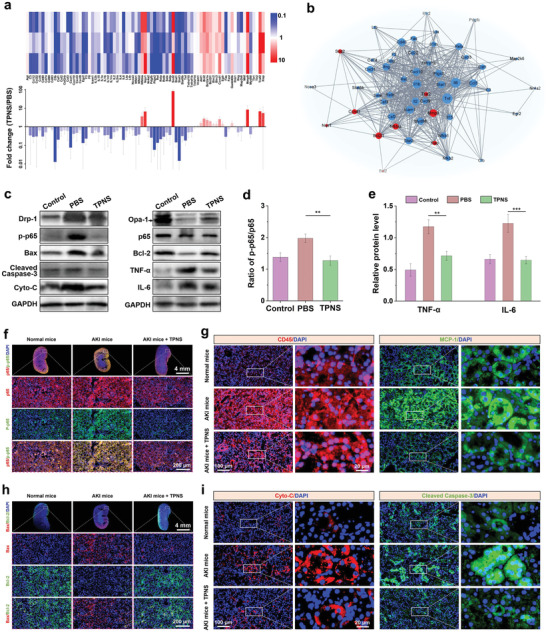
Therapeutic mechanisms of TPNS on AKI. a) PCR array heat map and fold change of differentially expressed genes in the NF‐κB signaling pathway. b) PPI network (protein–protein interaction) of differentially‐expressed genes (fold change ≥ 2 or ≤ 1/2) involved in the NF‐κB signaling pathway. c) Western blotting analysis of protein levels in renal tissues from different groups. Quantitative expression levels of d) p‐p65/p65 and e) inflammatory factors in renal tissues from different groups. Immunofluorescence staining of f) NF‐κB and g) CD45 and MCP‐1 levels in kidney sections from different groups. Immunofluorescence staining of h) Bax and Bcl‐2, and i) Cyto‐C and Cleaved Caspase‐3 levels in kidney sections from different groups. Statistical significance compared with the AKI group is shown (***p < 0.001; **p < 0.01). In (a), and (d,e), data represent mean ± SD from three independent replicates.