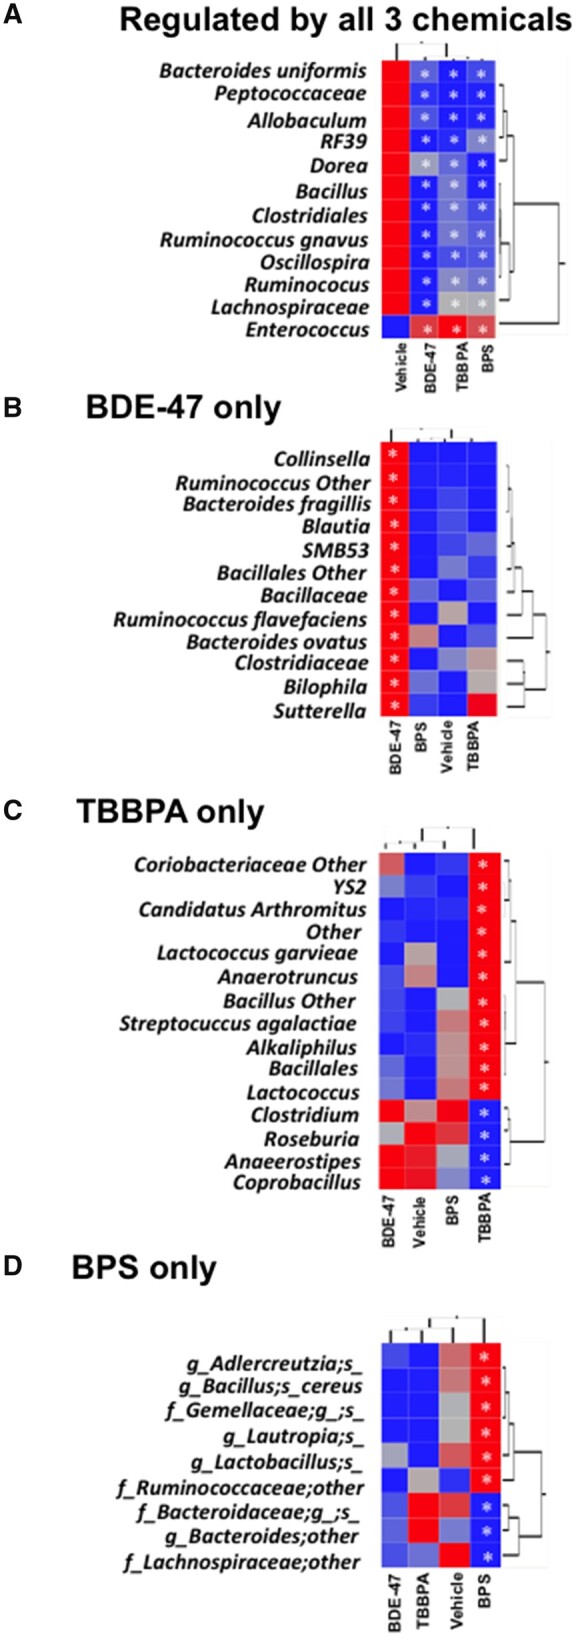
Figure 3.

Two-way hierarchical clustering dendrograms showing commonly and uniquely regulated taxa by early life chemical exposures. A, Bacteria that were commonly regulated by all 3 chemicals. B, Bacteria uniquely regulated by BDE-47. C, Bacteria uniquely regulated by TBBPA. D, Bacteria uniquely regulated by BPS. Asterisks represent statically significant changes as compared with vehicle-exposed group (1-way ANOVA followed by Duncan’s post hoc test, p < .05).
