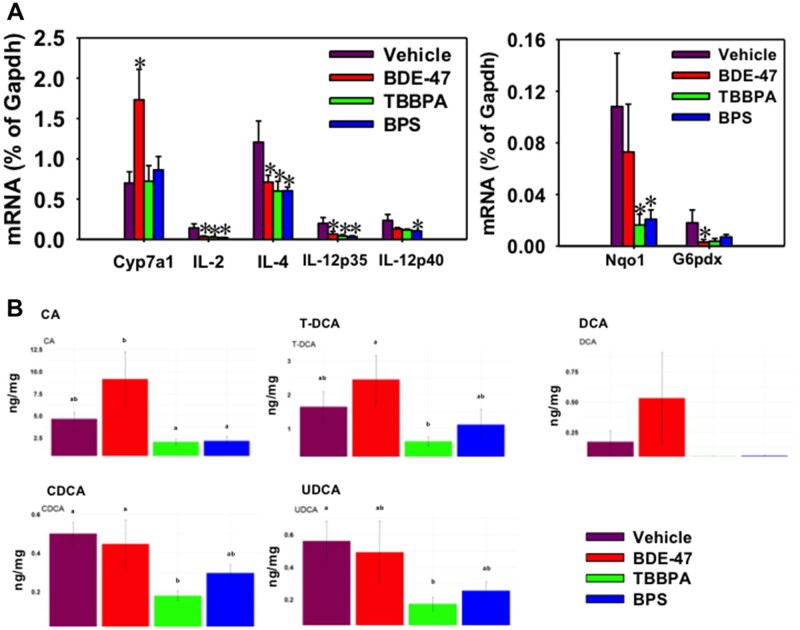
Figure 8.
A, Hepatic mRNA expression of the rate-limiting BA-synthetic enzyme Cyp7a1, inflammatory cytokines (IL-2, IL-4, IL-12p35, and IL-12p40) (left panel), as well as Nqo1 (the oxidative stress sensor Nrf2-target gene) and G6pdx (glucose metabolism). The mRNAs were quantified using RT-qPCR as described in Materials and Methods section. Data are normalized to the house-keeping gene Gapdh. Asterisks represent statistically significant differences as compared with the vehicle group (p < .05, one-way ANOVA followed by Duncan’s post hoc test). B, Hepatic BAs that were differentially regulated in adult age following early life chemical exposure. BAs were quantified using ultraperformance liquid chromatography coupled with mass spectrometry in tandem as described in Materials and Methods section. The letters a and b represent different post hoc groups (1-way ANOVA followed by Duncan’s post hoc test).

